so from here question is how we approch this.
Someone on FRR channel suggested possible leak within NIC drivers (they observed that behaviour in past) it can be the case or not
Thanks @hagbard, I started a simple test to do some tests and try something that could help.
I installed 7 routers (VyOS 20180921) using libvirt, almost simulating the topology from my setup before posted.
-
3 routers are external routers from a ASN, only eBGP with “test AS”
-
2 routers are internal to the same ASN, each one with 1 eBGP to above routers, and iBGP between them. They are connected to IGP by OSPF
-
2 internal routers only with OSPF
-
Scenario is running 3 days and 10 hours
-
All routers with 2GB RAM and I was verifying memory every 10min (492 logs) with “cat /proc/meminfo | grep MemFree”
-
On 1 of the Test ASN BGP router (VYOS 2) I connect another eBGP only to inject 710k real routes to my scenario
>> VYOS 1 =================
Only receiving only 2 routers (is an external router)
MemFree: 1799368 kB (read 1)
MemFree: 1779640 kB (read 492)
vyos@vyos1# run show ip bgp summary
BGP router identifier 10.1.1.1, local AS number 65001 vrf-id 0
BGP table version 7
RIB entries 13, using 2080 bytes of memory
Peers 1, using 21 KiB of memory
Neighbor V AS MsgRcvd MsgSent TblVer InQ OutQ Up/Down State/PfxRcd
10.10.101.2 4 65002 4953 4958 0 0 0 3d10h28m 2
>> VYOS 2 =================
Receiving 710k routers (advertised by real BGP router), propagate to another 710k to VYOS 5,
propagate 710k to iBGP VYOS 6, and 2 OSPF sessions
MemFree: 486452 kB (read 1)
MemFree: 456364 kB (read 492)
vyos@vyos2# run show ip bgp summary
IPv4 Unicast Summary:
BGP router identifier 10.1.1.2, local AS number 65002 vrf-id 0
BGP table version 5541888
RIB entries 1334424, using 204 MiB of memory
Peers 4, using 82 KiB of memory
Neighbor V AS MsgRcvd MsgSent TblVer InQ OutQ Up/Down State/PfxRcd
10.1.1.6 4 65002 4951 1062941 0 0 0 3d10h28m 0
10.10.101.1 4 65001 4959 4954 0 0 0 3d10h29m 5
10.10.104.2 4 65003 1062932 1062940 0 0 0 3d10h29m 1
192.168.255.1 4 265048 1287699 1062936 0 0 0 3d10h26m 733680
vyos@vyos2# run show ip ospf neighbor
Neighbor ID Pri State Dead Time Address Interface RXmtL RqstL DBsmL
10.1.1.3 1 Full/DROther 36.181s 10.10.102.2 eth0.102:10.10.102.1 0 0 0
10.1.1.6 1 Full/DROther 33.742s 10.10.105.2 eth0.105:10.10.105.1 0 0 0
vyos@vyos2# run show ip route summary
Route Source Routes FIB (vrf Default-IP-Routing-Table)
connected 6 6
static 1 0
ospf 8 6
ebgp 733770 733768
ibgp 0 0
Totals 733785 733780
>> VYOS 3 =================
Only OSPF Router, connecter do VYOS2
MemFree: 1800856 kB (read 1)
MemFree: 1782076 kB (read 492)
vyos@vyos3# run show ip ospf neighbor
Neighbor ID Pri State Dead Time Address Interface RXmtL RqstL DBsmL
10.1.1.2 1 Full/DROther 35.868s 10.10.102.1 eth0.102:10.10.102.2 0 0 0
10.1.1.4 1 Full/DROther 33.287s 10.10.103.2 eth0.103:10.10.103.1 0 0 0
>> VYOS 4 =================
Only OSPF Router connected to VYOS3
MemFree: 1805392 kB (read 1)
MemFree: 1778508 kB (read 492)
vyos@vyos4# run show ip ospf neighbor
Neighbor ID Pri State Dead Time Address Interface RXmtL RqstL DBsmL
10.1.1.3 1 Full/DROther 39.095s 10.10.103.1 eth0.103:10.10.103.2 0 0 0
>> VYOS 5 =================
eBGP with VYOS2, receiving 700k routes
MemFree: 728244 kB (read 1)
MemFree: 702180 kB (read 492)
vyos@vyos5# run show ip bgp summary
IPv4 Unicast Summary:
BGP router identifier 10.1.1.5, local AS number 65003 vrf-id 0
BGP table version 5541930
RIB entries 1334412, using 204 MiB of memory
Peers 1, using 21 KiB of memory
Neighbor V AS MsgRcvd MsgSent TblVer InQ OutQ Up/Down State/PfxRcd
10.10.104.1 4 65002 1062962 1062954 0 0 0 3d10h29m 733680
>> VYOS 6 =================
iBGP and OSPF with VYOS2, eBGP with VYOS7 (down session)
MemFree: 340440 kB (read 1)
MemFree: 315496 kB (read 4092)
vyos@vyos6# run show ip bgp summary
IPv4 Unicast Summary:
BGP router identifier 10.1.1.6, local AS number 65002 vrf-id 0
BGP table version 5541994
RIB entries 1334431, using 204 MiB of memory
Peers 2, using 41 KiB of memory
Neighbor V AS MsgRcvd MsgSent TblVer InQ OutQ Up/Down State/PfxRcd
10.1.1.2 4 65002 1062987 4954 0 0 0 3d10h30m 733692
10.10.106.2 4 65004 228573 228960 0 0 0 3d09h23m Connect
vyos@vyos6# run show ip ospf neighbor
Neighbor ID Pri State Dead Time Address Interface RXmtL RqstL DBsmL
10.1.1.2 1 Full/DROther 34.820s 10.10.105.1 eth0.105:10.10.105.2 0 0 0
>> VYOS 7 =================
eBGP with VYOS6, but only receiving connection problem (BGP down).
MemFree: 624124 kB (read 1)
MemFree: 697864 kB (read 492)
vyos@vyos7# run show ip bgp summary
IPv4 Unicast Summary:
BGP router identifier 10.10.106.2, local AS number 65004 vrf-id 0
BGP table version 2968951
RIB entries 0, using 0 bytes of memory
Peers 1, using 21 KiB of memory
Neighbor V AS MsgRcvd MsgSent TblVer InQ OutQ Up/Down State/PfxRcd
10.10.106.1 4 65002 228561 228573 0 0 0 3d09h23m Connect
==============================
-
On VYOS is a BGP down session and there remain 30MB memory used. Is this normal? If not, may deleted routes (from this router 7, other BGP routers and VyOS that was this bug reason) continue allocated?
-
30MB in 3 days is not muth memory compared with 6GB in 4 days.
@syncer, if this happens, how could we see this?
root@ROUTER-BGP:/home/luis# lspci | grep Eth
03:00.0 Ethernet controller: Broadcom Corporation NetXtreme II BCM5708 Gigabit Ethernet (rev 12)
05:00.0 Ethernet controller: Broadcom Corporation NetXtreme II BCM5708 Gigabit Ethernet (rev 12)
13:00.0 Ethernet controller: Intel Corporation 82571EB Gigabit Ethernet Controller (rev 06)
13:00.1 Ethernet controller: Intel Corporation 82571EB Gigabit Ethernet Controller (rev 06)
17:00.0 Ethernet controller: Mellanox Technologies MT27500 Family [ConnectX-3]
root@ROUTER-BGP:/home/luis# dmesg | grep eth
[ 2.154739] e1000e 0000:13:00.0 eth0: (PCI Express:2.5GT/s:Width x4) 00:15:17:24:75:18
[ 2.154742] e1000e 0000:13:00.0 eth0: Intel(R) PRO/1000 Network Connection
[ 2.154818] e1000e 0000:13:00.0 eth0: MAC: 0, PHY: 4, PBA No: C57721-005
[ 2.344709] e1000e 0000:13:00.1 eth1: (PCI Express:2.5GT/s:Width x4) 00:15:17:24:75:19
[ 2.344712] e1000e 0000:13:00.1 eth1: Intel(R) PRO/1000 Network Connection
[ 2.344789] e1000e 0000:13:00.1 eth1: MAC: 0, PHY: 4, PBA No: C57721-005
[ 2.900428] bnx2 0000:03:00.0 eth2: Broadcom NetXtreme II BCM5708 1000Base-T (B2) PCI-X 64-bit 133MHz found at mem f8000000, IRQ 16, node addr 00:1e:0b:ca:af:28
[ 3.800376] bnx2 0000:05:00.0 eth3: Broadcom NetXtreme II BCM5708 1000Base-T (B2) PCI-X 64-bit 133MHz found at mem fa000000, IRQ 17, node addr 00:1e:0b:ca:af:26
[ 10.283450] mlx4_en: eth4: Link Up
I have another server ( same HP ProLiant DL380), with 1 mellanox x3 board too, but another 4x1Gbps instead of 2x1Gbps ports.
The server is powered on (20 days) with default VyOS and memory is normal.
root@SERVER2-BGP:/home/vyos# free -h
total used free shared buffers cached
Mem: 7.8G 624M 7.2G 16M 138M 157M
-/+ buffers/cache: 328M 7.5G
Swap: 0B 0B 0Broot@SERVER2-BGP:/home/vyos# uptime
16:41:29 up 20 days, 12:41, 1 user, load average: 0.00, 0.00, 0.00
root@SERVER2-BGP:/home/vyos#
Boards are similar
root@SERVER2-BGP:/home/vyos# lspci | grep Eth
03:00.0 Ethernet controller: Broadcom Corporation NetXtreme II BCM5708 Gigabit Ethernet (rev 12)
05:00.0 Ethernet controller: Broadcom Corporation NetXtreme II BCM5708 Gigabit Ethernet (rev 12)
15:00.0 Ethernet controller: Intel Corporation 82575GB Gigabit Network Connection (rev 02)
15:00.1 Ethernet controller: Intel Corporation 82575GB Gigabit Network Connection (rev 02)
16:00.0 Ethernet controller: Intel Corporation 82575GB Gigabit Network Connection (rev 02)
16:00.1 Ethernet controller: Intel Corporation 82575GB Gigabit Network Connection (rev 02)
18:00.0 Ethernet controller: Mellanox Technologies MT27500 Family [ConnectX-3]
root@SERVER2-BGP:/home/vyos# dmesg -T | grep eth
[Thu Jan 20 03:59:32 2011] ACPI Error: Method parse/execution failed _SB._OSC, AE_AML_BUFFER_LIMIT (20180531/psparse-516)
[Thu Jan 20 03:59:34 2011] igb 0000:15:00.0: eth0: (PCIe:2.5Gb/s:Width x4) 00:1b:21:40:db:00
[Thu Jan 20 03:59:34 2011] igb 0000:15:00.0: eth0: PBA No: Unknown
[Thu Jan 20 03:59:34 2011] bnx2 0000:03:00.0 eth1: Broadcom NetXtreme II BCM5708 1000Base-T (B2) PCI-X 64-bit 133MHz found at mem f8000000, IRQ 16, node addr 00:1e:0b:cc:12:e4
[Thu Jan 20 03:59:34 2011] igb 0000:15:00.1: eth2: (PCIe:2.5Gb/s:Width x4) 00:1b:21:40:db:01
[Thu Jan 20 03:59:34 2011] igb 0000:15:00.1: eth2: PBA No: Unknown
[Thu Jan 20 03:59:35 2011] igb 0000:16:00.0: eth3: (PCIe:2.5Gb/s:Width x4) 00:1b:21:40:db:04
[Thu Jan 20 03:59:35 2011] igb 0000:16:00.0: eth3: PBA No: Unknown
[Thu Jan 20 03:59:35 2011] igb 0000:16:00.1: eth4: (PCIe:2.5Gb/s:Width x4) 00:1b:21:40:db:05
[Thu Jan 20 03:59:35 2011] igb 0000:16:00.1: eth4: PBA No: Unknown
[Thu Jan 20 03:59:35 2011] bnx2 0000:05:00.0 eth5: Broadcom NetXtreme II BCM5708 1000Base-T (B2) PCI-X 64-bit 133MHz found at mem fa000000, IRQ 17, node addr 00:1e:0b:cc:12:e2
[Thu Jan 20 03:59:42 2011] mlx4_en: eth6: Link Up
[Thu Jan 20 03:59:42 2011] mlx4_en: eth7: Link Up
root@SERVER2-BGP:/home/vyos#
affected servers are with e1000e
can you confirm that both affected servers with e1000e drivers?
in rc4 we added atoptool so will be little easier to collect required info
What about running the driver with debug? Would be 'modprobe debug:0-16 (16 is logging everything, very noisy makes sure you have enough space). I see issues with the e100 and e1000 in a virtual environment too, kernel resets and reloads it. I’m going to test the setup above and leave the boxes running, to reproduce.
The problem was only this module loaded?
Server with 1.2.0-rolling+201809210337, less than 4 days UP = memory problems
root@SERVER-BGP:/home/luis# lsmod | grep e100
e1000e 225280 0
root@SERVER-BGP:/home/luis# lspci | grep Eth
03:00.0 Ethernet controller: Broadcom Corporation NetXtreme II BCM5708 Gigabit Ethernet (rev 12)
05:00.0 Ethernet controller: Broadcom Corporation NetXtreme II BCM5708 Gigabit Ethernet (rev 12)
13:00.0 Ethernet controller: Intel Corporation 82571EB Gigabit Ethernet Controller (rev 06)
13:00.1 Ethernet controller: Intel Corporation 82571EB Gigabit Ethernet Controller (rev 06)
17:00.0 Ethernet controller: Mellanox Technologies MT27500 Family [ConnectX-3]
Same server above(only difference is eth board 82575GB vs 82571EB), and not running BGP/OSPF yet, 21 days UP = no problems
root@SERVER2-BGP:/home/vyos# lsmod | grep e100
root@SERVER2-BGP:/home/vyos# lspci | grep Eth
03:00.0 Ethernet controller: Broadcom Corporation NetXtreme II BCM5708 Gigabit Ethernet (rev 12)
05:00.0 Ethernet controller: Broadcom Corporation NetXtreme II BCM5708 Gigabit Ethernet (rev 12)
15:00.0 Ethernet controller: Intel Corporation 82575GB Gigabit Network Connection (rev 02)
15:00.1 Ethernet controller: Intel Corporation 82575GB Gigabit Network Connection (rev 02)
16:00.0 Ethernet controller: Intel Corporation 82575GB Gigabit Network Connection (rev 02)
16:00.1 Ethernet controller: Intel Corporation 82575GB Gigabit Network Connection (rev 02)
18:00.0 Ethernet controller: Mellanox Technologies MT27500 Family [ConnectX-3]
Server running 1.2.0-rolling+201807230337, DL360 G5, UP 87 days, running BGP v4/v6, VRRP = no problems
root@SERVER3-BGP:/home/luis# lsmod | grep e100
root@SERVER3-BGP:/home/luis# lspci | grep Eth
03:00.0 Ethernet controller: Broadcom Corporation NetXtreme II BCM5708 Gigabit Ethernet (rev 12)
05:00.0 Ethernet controller: Broadcom Corporation NetXtreme II BCM5708 Gigabit Ethernet (rev 12)
0b:00.0 Ethernet controller: Intel Corporation 82599ES 10-Gigabit SFI/SFP+ Network Connection (rev 01)
0b:00.1 Ethernet controller: Intel Corporation 82599ES 10-Gigabit SFI/SFP+ Network Connection (rev 01)
13:00.0 Ethernet controller: Intel Corporation 82599ES 10-Gigabit SFI/SFP+ Network Connection (rev 01)
13:00.1 Ethernet controller: Intel Corporation 82599ES 10-Gigabit SFI/SFP+ Network Connection (rev 01)
Virtual VyOS with libvirt
root@vyos1:/home/vyos# lsmod | grep e100
root@vyos1:/home/vyos# lspci | grep Eth
00:03.0 Ethernet controller: Red Hat, Inc Virtio network device
It’s clearly bgpd, resident memory 1.2GB. Something weird is going on there. I tried to reproduce your issue, but haven’t been successful so far. My memory stays between 10-11% (2 core, 1024MB) steady.
But I also have only messages exchange when bgp comes up, authentications, makes the imports and exports and then there is only checking, no removals or new imports. I’m going to simulate that next to see what’s going on. Just so you know we are still looking into it.
Thanks @hagbard
Some logs more, again, to try to help:
free -h
total used free shared buffers cached
Mem: 7.8G 7.0G 798M 20M 126M 298M
-/+ buffers/cache: 6.6G 1.2G
Swap: 0B 0B 0B
show-memory.txt (31.6 KB)
more-info.txt (20.4 KB)
BGP peers
run show ip bgp summary
IPv4 Unicast Summary:
BGP router identifier 172.xxx.0.101, local AS number xxxx vrf-id 0
BGP table version 4107694
RIB entries 1335225, using 204 MiB of memory
Peers 7, using 144 KiB of memory
Neighbor V AS MsgRcvd MsgSent TblVer InQ OutQ Up/Down State/PfxRcd
172.xxx.251.9 4 xxxx 4296 1066006 0 0 0 2d23h51m 8
172.xxx.0.3 4 xxxx 182795 991675 0 0 0 2d23h52m 3032
xxx.xxx.143.253 4 xxxx 20035 4322 0 0 0 2d23h52m 18676
xxx.xxx.143.254 4 xxxx 32235 4322 0 0 0 2d23h52m 18676
xxx.xxx.55.94 4 xxxx 1043217 8681 0 0 0 2d23h52m 716802
2001:yyyy:dddd:3e::a 4 xxxx 45350016 4323 0 0 0 2d23h52m NoNeg
2804:yyyy:dddd:ffff::2 4 xxxx 696521 45107871 0 0 0 2d23h51m 103212
Total number of neighbors 7
Total routes
run show ip route summary
Route Source Routes FIB (vrf Default-IP-Routing-Table)
connected 11 11
static 9 0
ospf 206 200
ebgp 717908 717908
ibgp 3002 3002
Totals 721136 721121
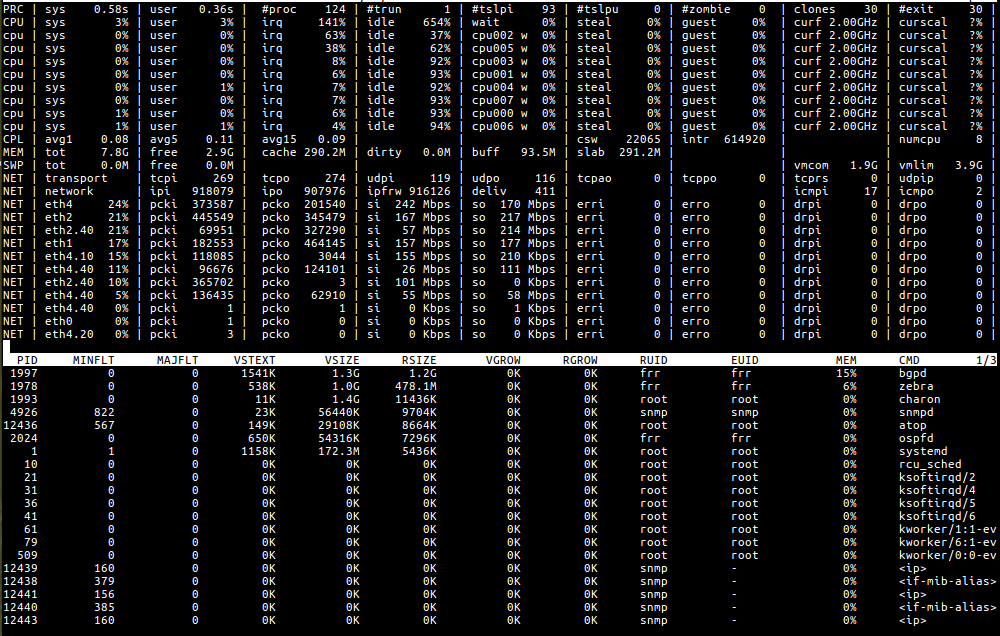
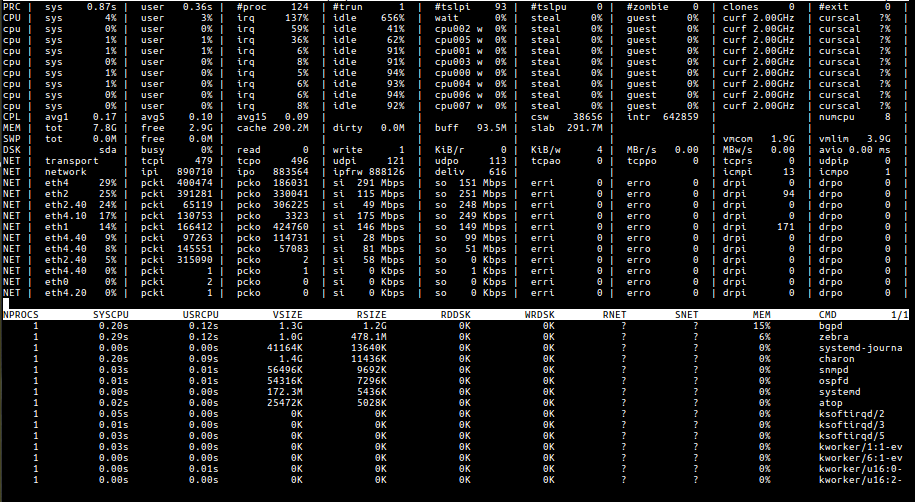
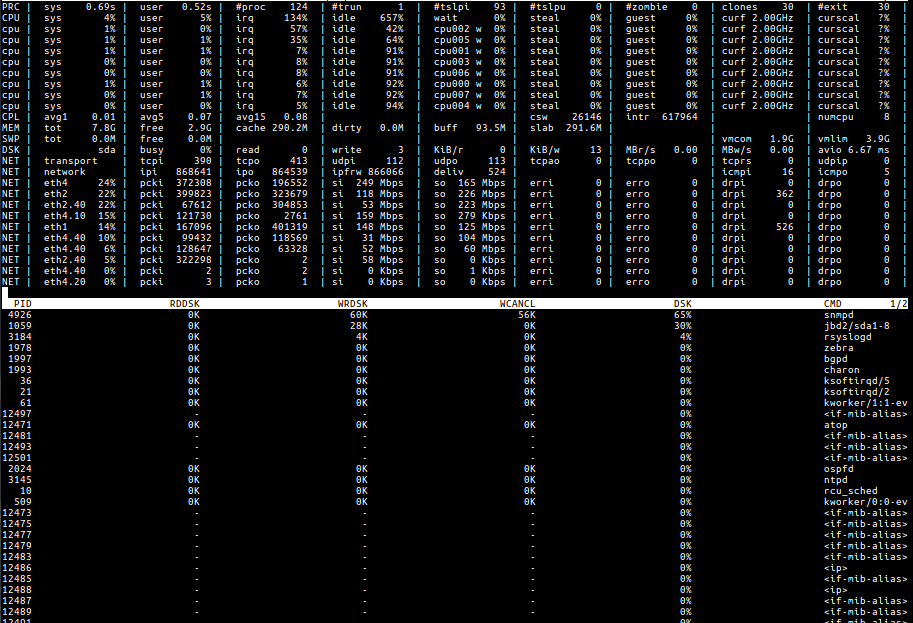
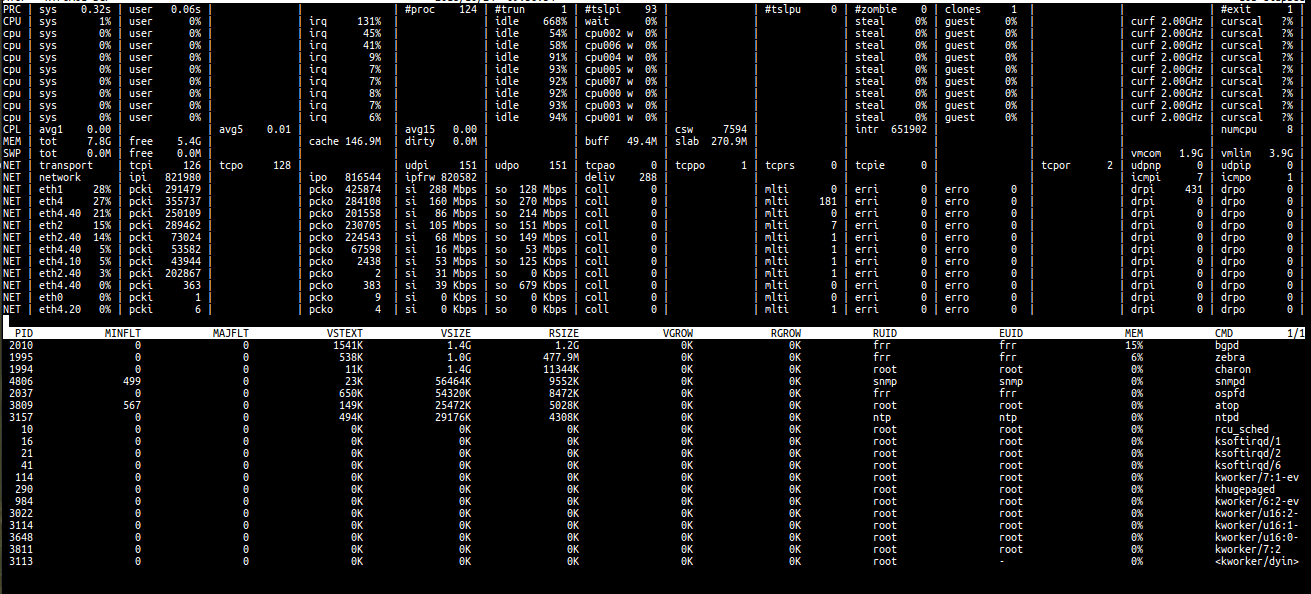
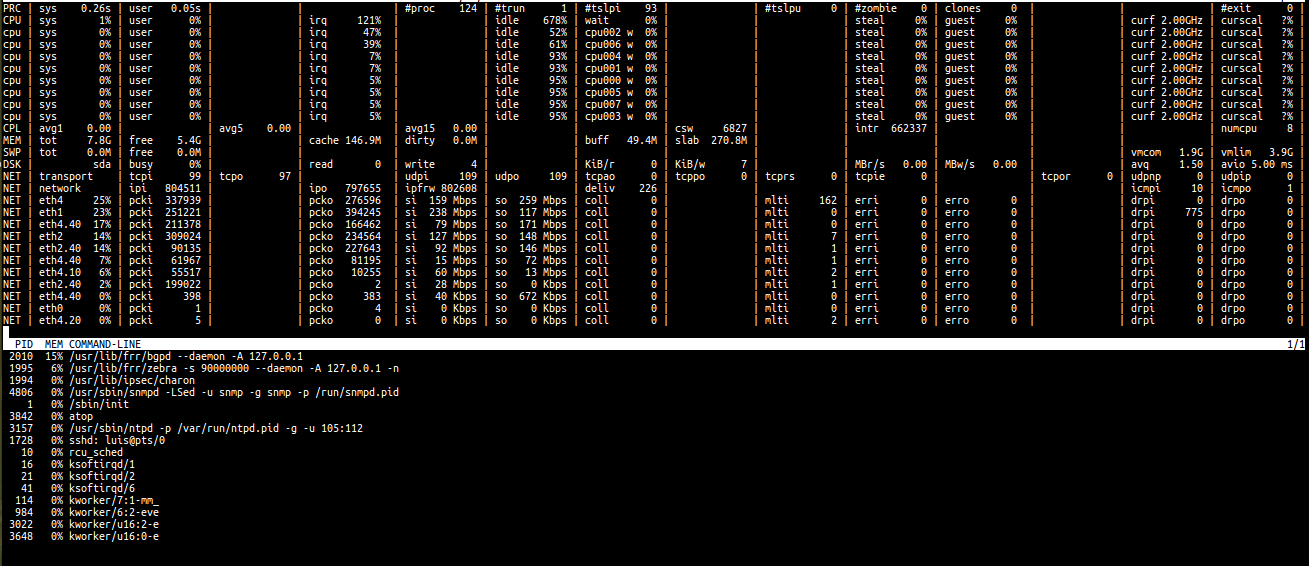
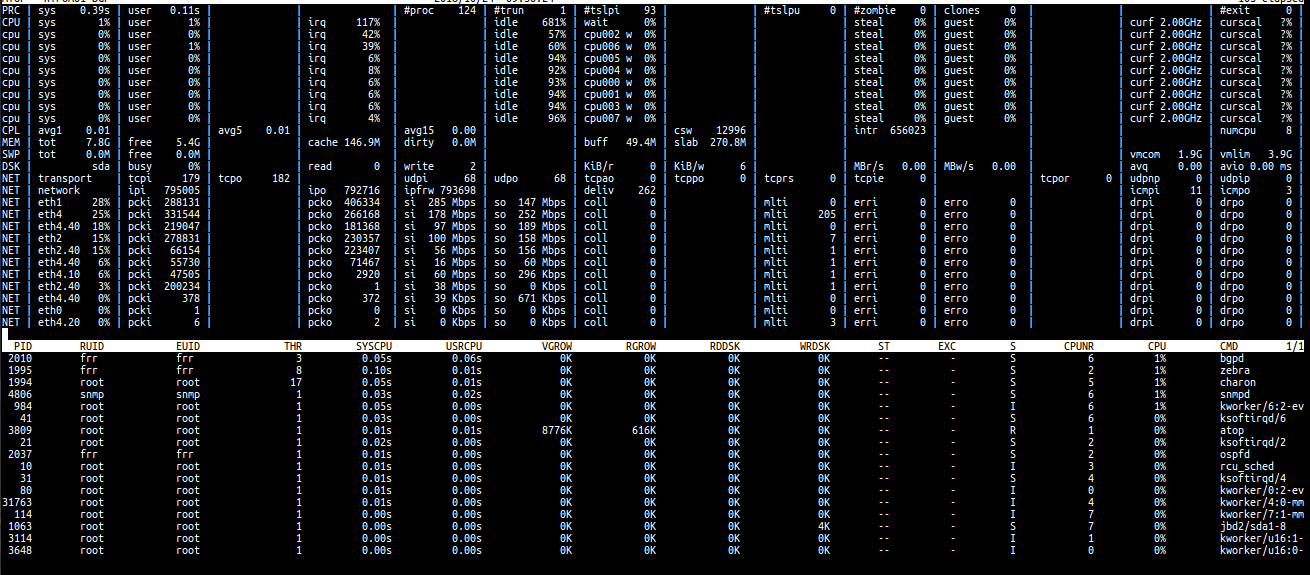
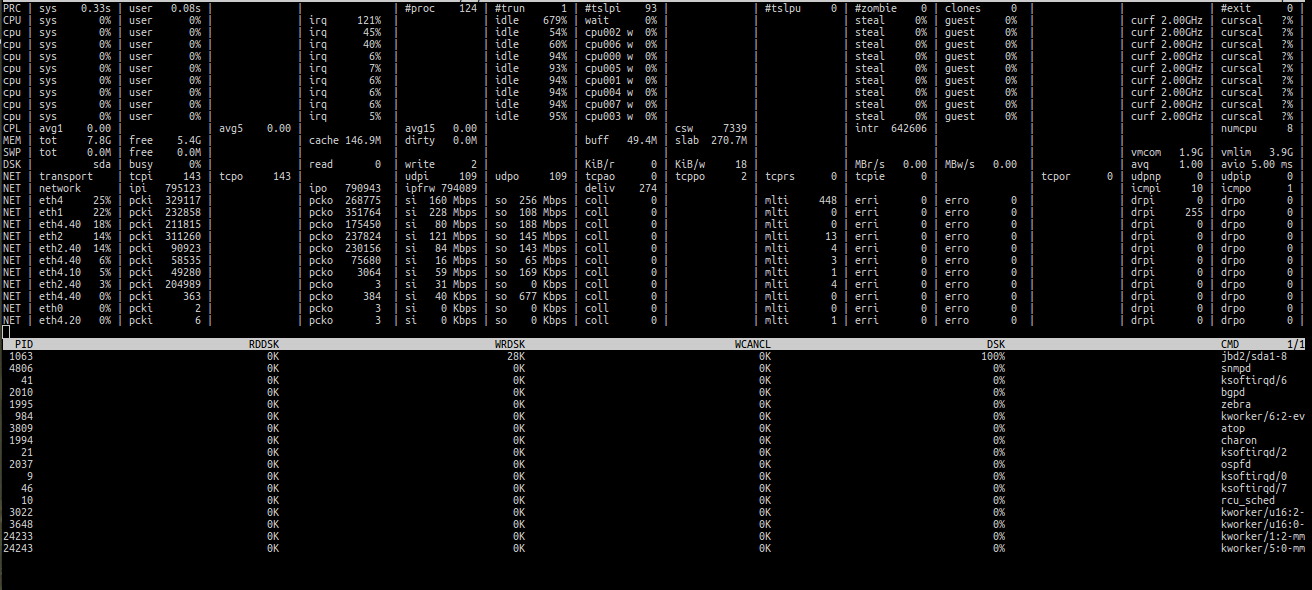
ATOP Memory
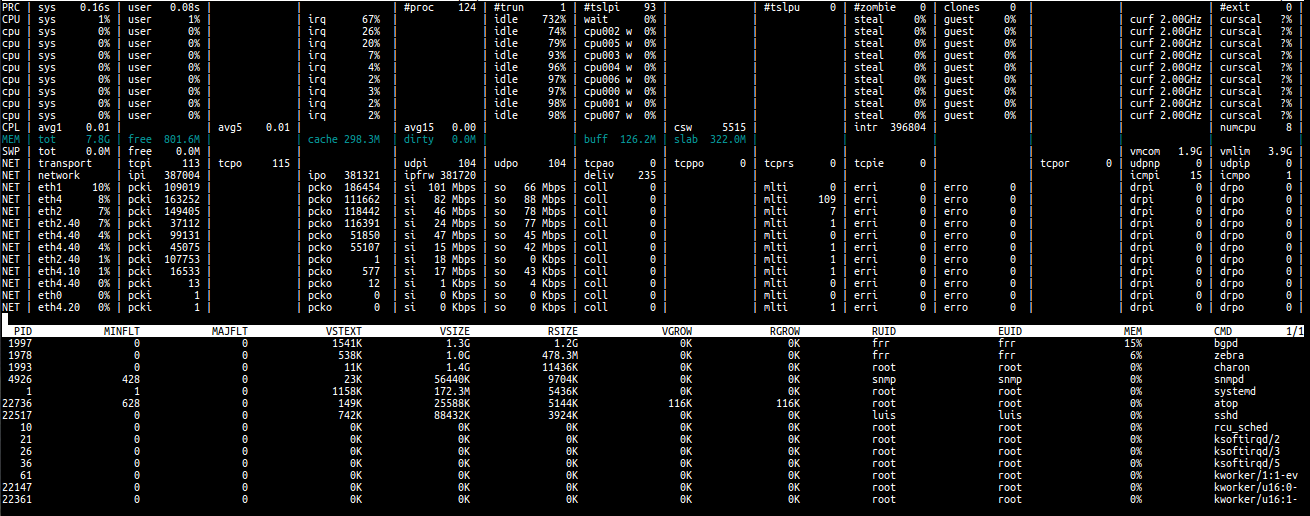
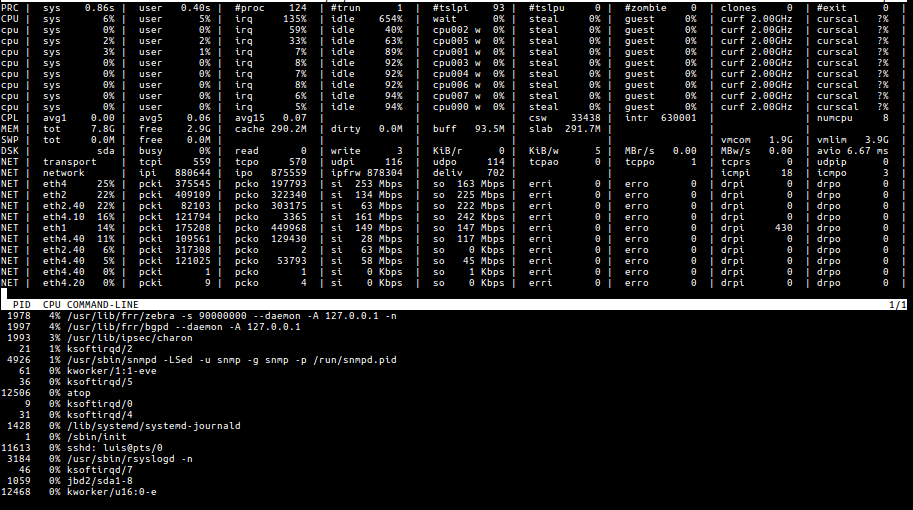
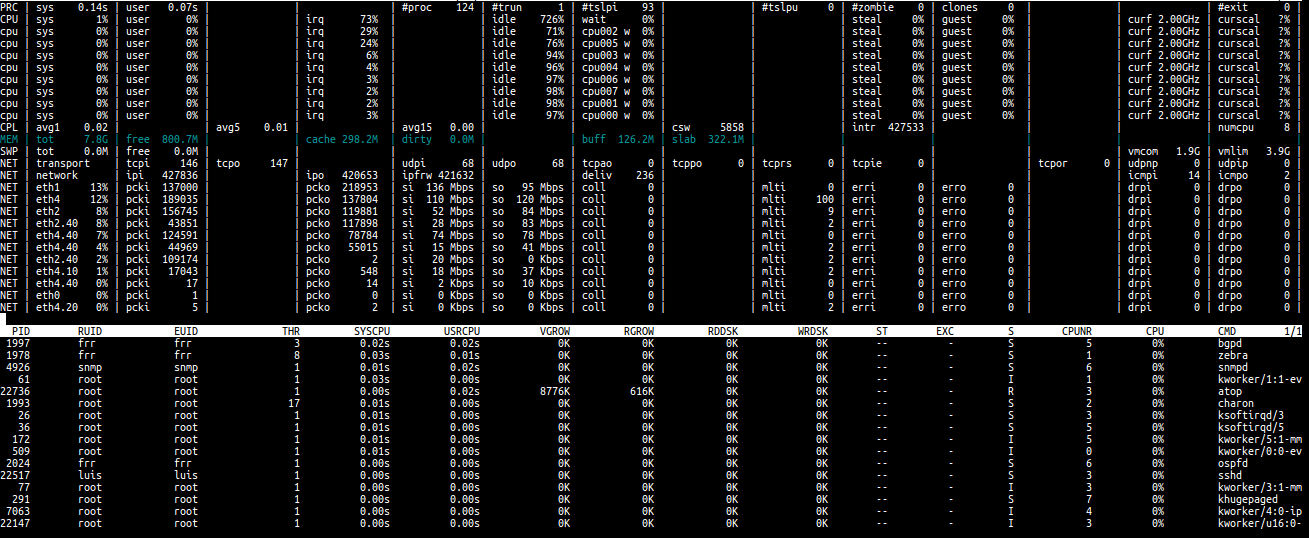
ATOP CPU
Thanks a lot. I’m still trying to get bgp eating my memory, I have now a similar setup with 6 VMs sitting there for 2 days, but no issues right now. I wonder if its the amount of routes, I used 1000 RFC1918 networks /24s and the RFC3849 for IPv6 (/64s), without aggregating them. Aside of being entirely unefficent, I wasn’t able to see anything going wrong. Also the strace I produced looks quite ok. I may have to get closer to your 700k routes, I believe that may cause the issue.
I have used this BGP Lab | Greg Sowell Saves The World when playing around with BGP It may help in getting a lot of routes.
I was using real routes with a real ISP ASN but it’s a nice option @ArneO.
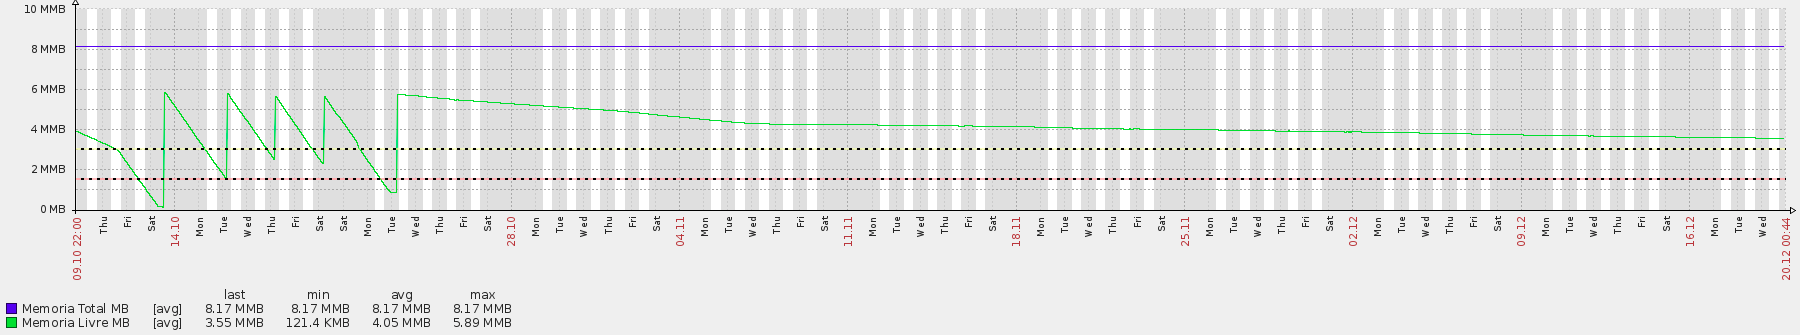
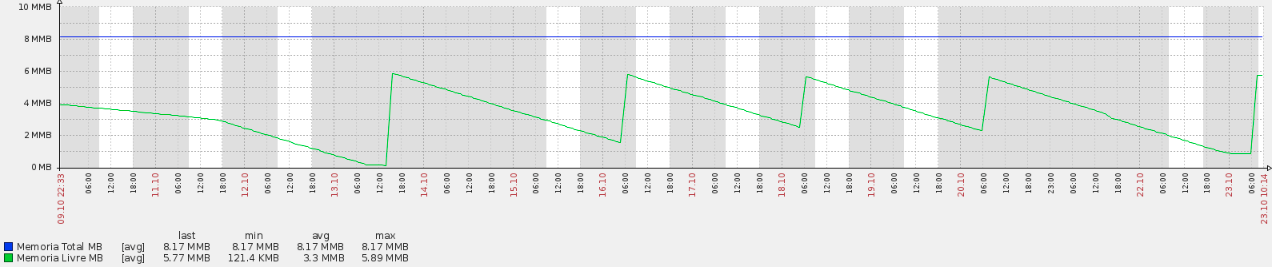
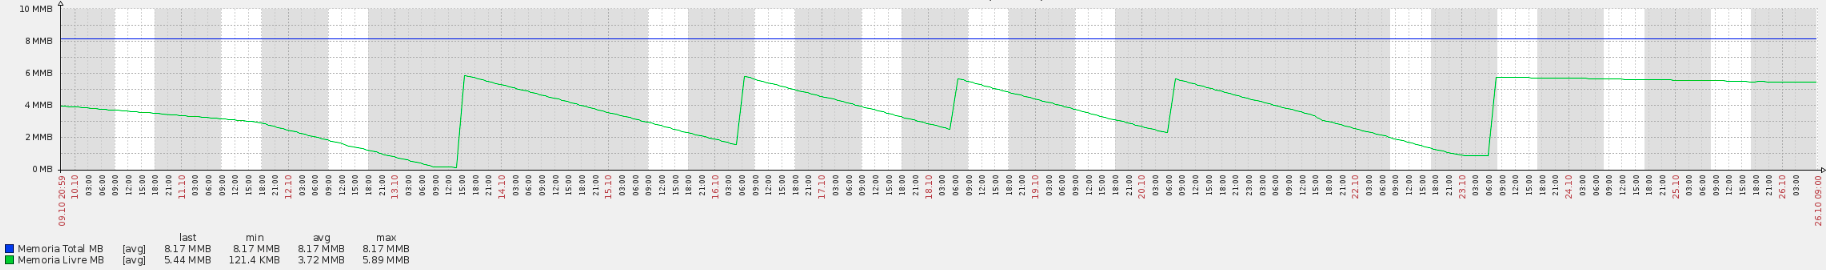
2 days ago I installed ATOP after @syncer comment. This was aprox 23h PM Brazil, then I post those information. Then, 6 AM from the next day (yesterday morning) I restarted the server again. Today I look to the memory graph and it seems stable. How? (130MB used in 30h)
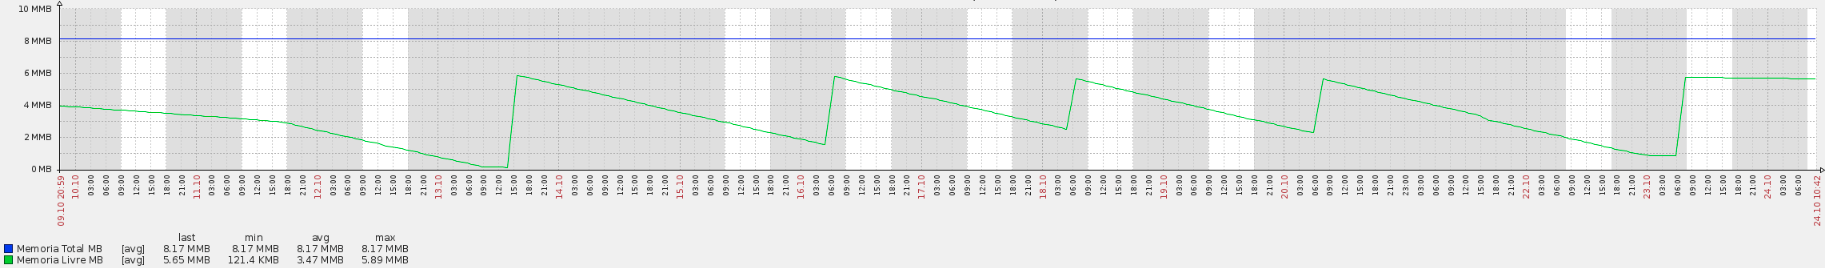
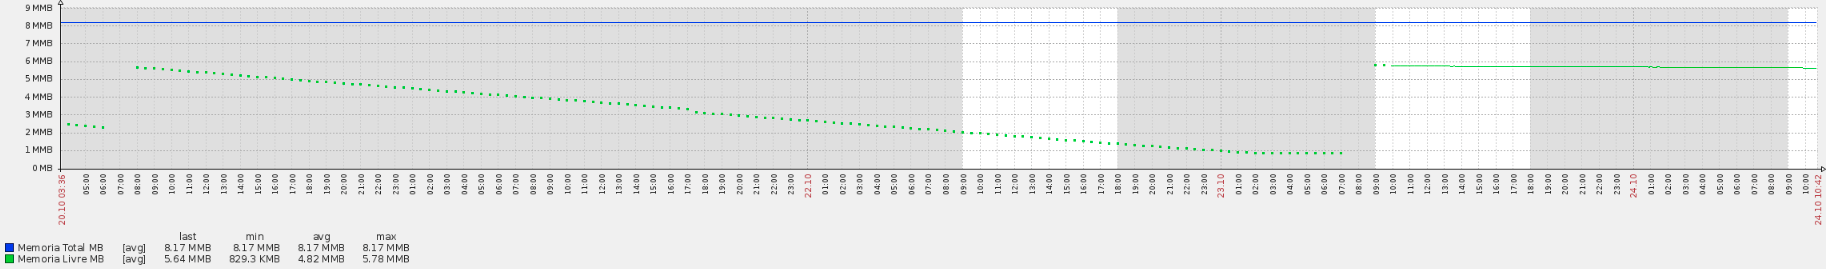
Until yesterday morning 10AM I was using memory SNMP check every 1.800s, then I changed interval to 300s (OID .1.3.6.1.4.1.2021.4.11.0). This change can be seen with “dots” on the next image.
luis@SERVER-BGP:~$ show system uptime
09:47:38 up 1 day, 3:22, 1 user, load average: 0.08, 0.03, 0.01
luis@SERVER-BGP:~$ show system memory
Total: 7982
Free: 5702
Used: 2280
luis@SERVER-BGP:~$ show ip route summary
Route Source Routes FIB (vrf Default-IP-Routing-Table)
connected 11 11
static 9 0
ospf 206 200
ebgp 717775 717775
ibgp 3021 3021
Totals 721022 721007
luis@SERVER-BGP:~$ show ip bgp summary
IPv4 Unicast Summary:
BGP router identifier 172.18.0.101, local AS number xxx vrf-id 0
BGP table version 2144917
RIB entries 1335130, using 204 MiB of memory
Peers 7, using 144 KiB of memory
Neighbor V AS MsgRcvd MsgSent TblVer InQ OutQ Up/Down State/PfxRcd
aaa.bbb.251.9 4 xxx 1641 496480 0 0 0 1d03h20m 8
aaa.bbb.0.3 4 xxx 138284 453746 0 0 0 1d03h20m 3053
aaa.bbb.143.253 4 xxx 11306 1650 0 0 0 1d03h20m 18759
aaa.bbb.143.254 4 xxx 15695 1650 0 0 0 1d03h20m 18767
aaa.bbb.55.94 4 xxx 523444 3296 0 0 0 1d03h20m 716681
aaaa:bbbb:1603:3e::a 4 xxx 824097 1651 0 0 0 1d03h20m NoNeg
aaaa:bbbb:f0ca:ffff::2 4 xxx 369540 1251423 0 0 0 1d03h20m 103307
Total number of neighbors 7
luis@SERVER-BGP:~$ show ipv6 bgp summary
IPv6 Unicast Summary:
BGP router identifier 172.18.0.101, local AS number xxx vrf-id 0
BGP table version 1588912
RIB entries 114058, using 17 MiB of memory
Peers 7, using 144 KiB of memory
Neighbor V AS MsgRcvd MsgSent TblVer InQ OutQ Up/Down State/PfxRcd
2001:xxx:xxx:3e::a 4 wwww 824099 1651 0 0 0 1d03h20m 59991
2804:xxx:xxx:ffff::2 4 wwww 369540 1251488 0 0 0 1d03h20m 7
Total number of neighbors 2
root@SERVER-BGP:/home/luis# lsmod | grep e100
e1000e 225280 0
memory-3.txt (31.6 KB)
Did anything else change?
If your memory usgae goes up again, can you please run ‘sh ip bgp memory’
Hi.
I only installed ATOP.
If ATOP doesn’t installed something that “corrected” the problem, then this was pure coincidence.
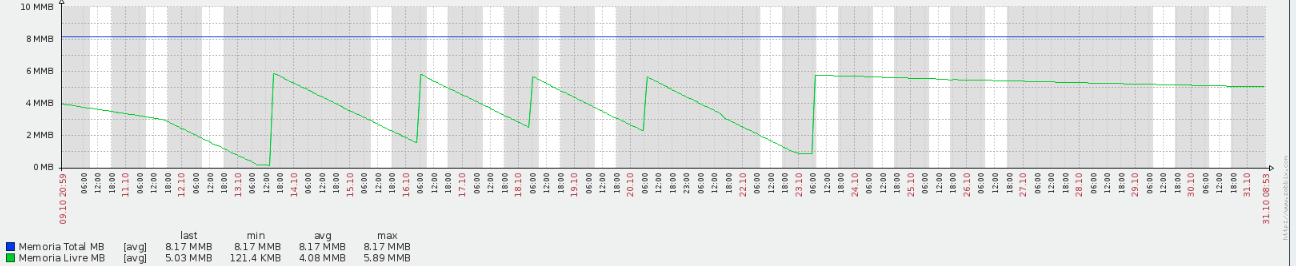
Now, system is UP 8 days and with more than 5GB free memory.
Memory remains decreasing, but slower.
memory_8days.txt (31.6 KB)
Below 21 days memory monitoring:
luis@SERVER-BGP:~$ show system uptime
07:51:35 up 8 days, 1:26, 1 user, load average: 0.00, 0.00, 0.00
luis@SERVER-BGP:~$ show system memory
Total: 7982
Free: 5185
Used: 2797
luis@SERVER-BGP:~$
show ip bgp memory
1451635 RIB nodes, using 222 MiB of memory
922681 BGP routes, using 99 MiB of memory
3052 BGP route ancillaries, using 644 KiB of memory
14 Static routes, using 1904 bytes of memory
8 Packets, using 448 bytes of memory
2224245 Adj-Out entries, using 153 MiB of memory
170 Nexthop cache entries, using 12 KiB of memory
287925 BGP attributes, using 64 MiB of memory
5 unknown attributes
131820 BGP AS-PATH entries, using 5149 KiB of memory
132038 BGP AS-PATH segments, using 3095 KiB of memory
637 BGP community entries, using 25 KiB of memory
733 BGP community entries, using 23 KiB of memory
75 BGP large-community entries, using 3000 bytes of memory
16 peers, using 328 KiB of memory
504 hash tables, using 32 KiB of memory
1875167 hash buckets, using 57 MiB of memory
16 compiled regexes, using 1024 bytes of memory
To more clear, attacked are shell and vyos commands executed some days before and after ATOP install.
last_shell_commands.txt (5.2 KB)
last_vyos_commands.txt (13.1 KB)