Help troubleshooting routing performance issue 1 way only

Hi there,

I’m running into a performance issue when routing data between 2 subnets.
I can reproduce it with iPerf3 and its strange as it only happens in 1 way.

So, the issue is happening when routing TCP data between 2 subnets/Vlans.
My Desktop is on subnet A and my NAS is on subnet B.

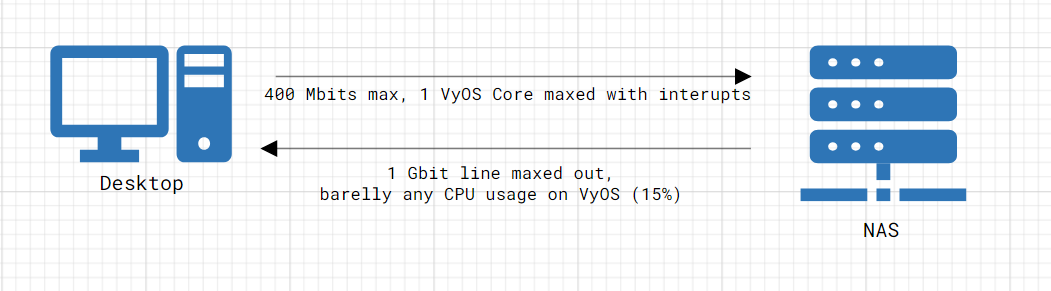
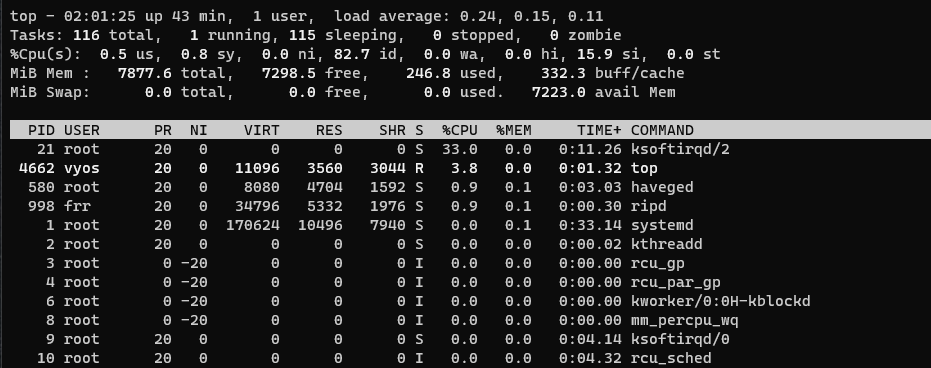
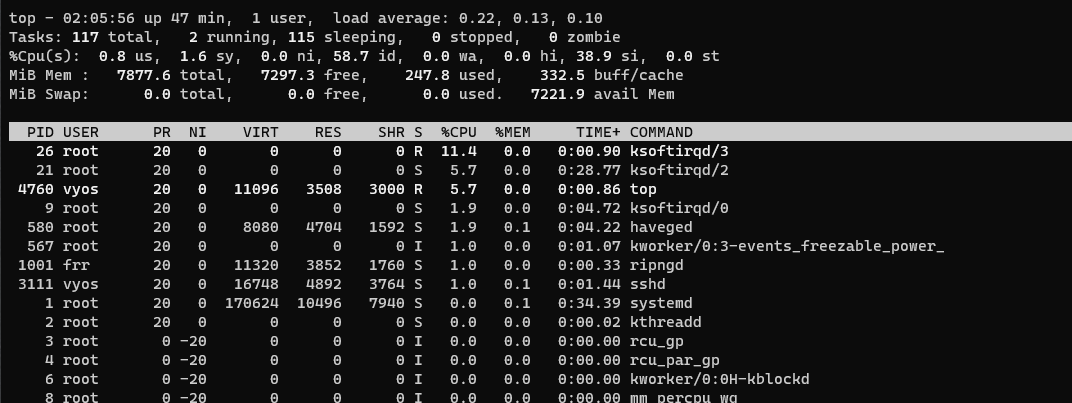
I have GRO, GSO, SG And TSO offloads enabled and I have fine performance on everything except on traffic going from Subnet A (Vlan50) to Subnet B(Vlan1).
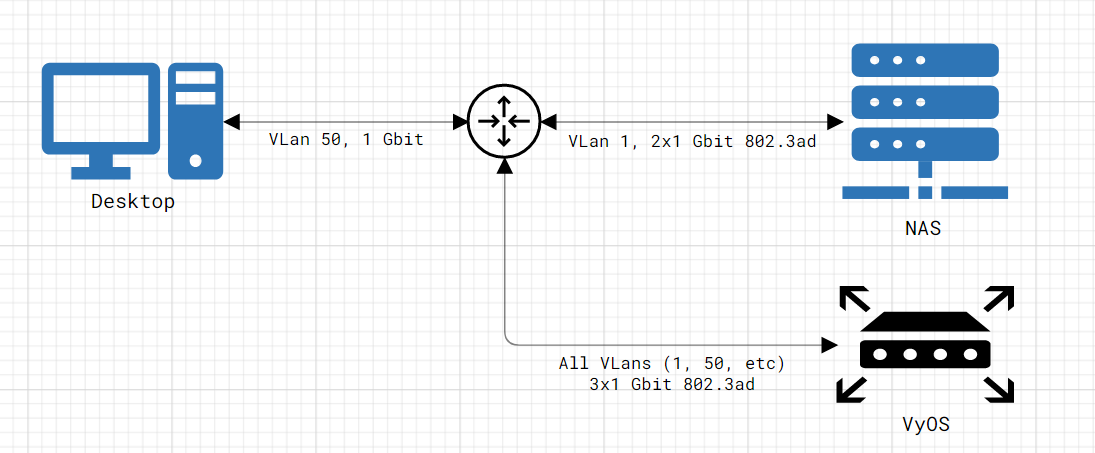
Here is my setup:

  1. Desktop connected to switch over 1Gbit LAN.
  2. VyOS box connected to switch over 3x1Gbit link 802.3ad LAGG, carrying all traffic over multiple VLans.
  3. NAS connected to switch over 2x1Gbit link 802.3ad LAGG.
  4. Switch is a Netgear GS724Tv4
  5. The 2 subnets work on separate VLans, NAS is on VLan 1 and Desktop on VLan 50.
  6. There is no firewall rules between the Subnets.

Here is a visual representation:

My thoughts and tests on points above:

  1. If the problem was with the lag between VyOS and the switch, I would expect both traffic directions to be affected.
  2. Not sure if this could affect something, but is strange that it would, still is a LAGG into a LAGG. I don’t know enough to know possible issues from this. I’ve tested with a laptop running on the VLan 1 and it can communicate fine with the NAS at full link speed (this bypasses VyOS as its the same VLan and subnet).

Additionally, I’ve checked and both VyOS, the Router and my Desktop are set to 1500MTU, with the Switch configured to allow Max Frame size of 1518.

Any ideas what could affect the routing only 1 way or troubleshooting I can do?

Hello @Ralm,

Did you check the MTU on the NAS?
Can you paste the output of the command from VyOS?:
netstat -s

Indeed check if packets get fragmented
Could also be combination of tagged vlans, 802.3AD and used NICs not performing.

MTU on the NAS is set to 1500 also.

Please find the netstat -s bellow:

netstat -s
vyos@vyos:~$ netstat -s
Ip:
    Forwarding: 1
    210158951 total packets received
    66 with invalid headers
    209428728 forwarded
    0 incoming packets discarded
    605017 incoming packets delivered
    209651535 requests sent out
    1 dropped because of missing route
    4 reassemblies required
    2 packets reassembled ok
    2 fragments received ok
    4 fragments created
Icmp:
    720 ICMP messages received
    0 input ICMP message failed
    ICMP input histogram:
        destination unreachable: 701
        echo requests: 8
        echo replies: 11
    26442 ICMP messages sent
    0 ICMP messages failed
    ICMP output histogram:
        destination unreachable: 26344
        time exceeded: 66
        echo requests: 24
        echo replies: 8
IcmpMsg:
        InType0: 11
        InType3: 701
        InType8: 8
        OutType0: 8
        OutType3: 26344
        OutType8: 24
        OutType11: 66
Tcp:
    10 active connection openings
    72 passive connection openings
    74 failed connection attempts
    3 connection resets received
    1 connections established
    23049 segments received
    40026 segments sent out
    0 segments retransmitted
    0 bad segments received
    462 resets sent
Udp:
    172551 packets received
    52 packets to unknown port received
    0 packet receive errors
    172494 packets sent
    0 receive buffer errors
    0 send buffer errors
    IgnoredMulti: 408645
UdpLite:
TcpExt:
    68 resets received for embryonic SYN_RECV sockets
    ArpFilter: 12
    3 TCP sockets finished time wait in fast timer
    78 delayed acks sent
    Quick ack mode was activated 10 times
    702 packet headers predicted
    8482 acknowledgments not containing data payload received
    12722 predicted acknowledgments
    TCPBacklogCoalesce: 9
    TCPDSACKOldSent: 10
    TCPDeferAcceptDrop: 68
    TCPRcvCoalesce: 1
    TCPAutoCorking: 356
    TCPOrigDataSent: 38666
    TCPDelivered: 38670
IpExt:
    InNoRoutes: 2
    InMcastPkts: 7258
    InBcastPkts: 408753
    InOctets: 678317447880
    OutOctets: 1355489281066
    InMcastOctets: 232256
    InBcastOctets: 72353584
    InNoECTPkts: 588419795
    InECT0Pkts: 80692
vyos@vyos:~$

I don’t think it is, because every other scenario is working fine.
For example, I have 1000 Down, 400 Up internet connection and I can download at 100MB/s without any issue.
If it was an issue between Vlans and 802.3AD, I would expect to affect any traffic between VyOS and the Switch.

Also, the NIC that I have on VyOS is an Intel ET2 Quad, which I have a hard time believing would have issues with this config.

My idea behind previous post: Probably VLAN1 is untagged, and there is no speed issue for traffic entering on vlan1
However, the other way around, traffic enters on tagged vlan , giving cpu load.
On which process CPU spends most time?

To prove LAG is not an issue, test the LAG by removing 2 of the 3 members and see if the issue persists. Then, if it clears up, add back one at a time.

Also, it appears you have two lags, 2G from the NAS and 3G from router to switch?

Have you checked CPU/memory on the NAS?
Watch your resources as you transfer data from the NAS, across the network to your desktop and paste it here.

Can you get a pcap and paste it here?

Hi there,

Thank you very much for the ideas guys, I will give them a try.

@16again
yeah its a good point, I really thought I had VLan 1 untagged, but I just double check and I’m actually sending all VLans (including 1) tagged to router via the LAG.
Then on the router I defined the subnets based on it.
Here is my LAG interface configuration on the router:

LAG interface config
 bonding bond0 {
        description "LAN Bond"
        firewall {
            local {
                name LAN-LOCAL
            }
        }
        hash-policy layer2
        member {
            interface eth2
            interface eth3
            interface eth4
        }
        mode 802.3ad
        vif 1 {
            address 10.99.10.1/24
        }
        vif 30 {
            address 10.30.30.1/24
        }
        vif 50 {
            address 10.10.10.1/24
        }
    }

Regarding the process, its a single interrupt, maxing out a single core.

This is a 4 core CPU and its strange it doesn’t try to use more in this instance.
The NIC supports it natively and it does spread the load in other scenarios.
For example, here is the CPU usage while doing a 1Gbit/s download speedtest from the internet:

In this last screenshot we can see a process called “kworker/u8-2-bond0”, so I wonder if that process is responsible for the LAG. If it is, kinda proves that is not the bottleneck.

@ocosa
Yes, the NAS right now has a 2G and the router a 3G.
In fact, the NAS is configured to use a 4 member link, but I only have 2 cables connected.
I’ve done the test you suggested from the NAS prespective but not with the Router LAG.
I will give it a try and report back.

Regarding the NAS resources, its an HP DL380p running TrueNAS with a 6c12T CPU and 32GB of Ram, barely breaks a sweat, its like 15% CPU usage if that much and most of it most likely is ZFS computations.

@everyone

Is there any other offloads I can set on the NIC other then the 4 I already defined (GRO, GSO, SG And TSO)?

@ocosa
Just tested the router with a single member connected and no difference.

Hi @Ralm,
What types of NICs are in the bond on VyOS?

Hi @Nikolay
Its a single Intel ET2 Quad

oh, forgot to mention, I’m running VyOS 1.3.0-rc6.
I will update it to the epa3 release and double check if the issue persists.

Looks like problem discussed here:
Intel ET2 Quad Very High CPU usage - IGB driver

I would try removing the bonding completely. Not leave one interface in the bond, but remove it completely. And check on a single interface.
Or make one interface for one VLAN

EP2 no difference.

Again, that doesn’t explain why every single scenario on my network is fine except for a specific route.
Also, if you notice, that thread was mine and was a problem of PfSense running extremely outdated drives. That thread was the main reason I moved to VyOS.

I don’t see any logical explanation to be an issue with the NIC directly or the LAG.

WAN -> LAN, 1 Gbit/s no problem:

Now, between the exact same 2 machines:

Lan on Vlan1 Tagged -> Lan on Vlan50 Tagged = although its using 78% on a single core, I'm routing almost twice the bandwidth (900 Mbits/s iPerf3) and I would even say its maxing out a 1Gbit/s line (the limit of the desktop machine)

Lan on Vlan50 Tagged -> Lan on Vlan1 Tagged = crap, 1 core completely maxed out at 99% usage, resulting on low routing speed (520 Mbits/s iPerf3)

This for me looks like some configuration issue, some edge case or some offload missing.
I’m even curious if VyOS 1.2 doesn’t have this problem at all again, because I’ve been having many issues with VyOS 1.3 due to all offloads being turned off by default.

Enabled RPS offload (Receive Packet Steering) and has improved the CPU usage significantly, however the performance is worse overall.

CPU usages with RPS set:

Vlan 50 to Vlan 1 | 1 core 33% usage | Transfer speed 360 Mbit/s

Vlan 1 to Vlan 50 | 3 cores 1.9%, 5.7% 11.4% usage | Transfer speed 490 Mbit/s

Hello @Ralm, did you try to increase ring buffers?
Which LAG balancing mode was configured?

Hi @Dmitry,
I wasn’t aware of the ring buffers, I’ve never played with it, but I did some research and found this nice article from you guys at System Optimization - Knowledgebase / General / System Settings - VyOS

I will play around increasing it a bit to see if it helps.
FYI currently, its set as following:

Pre-set maximums:
RX:             4096
RX Mini:        0
RX Jumbo:       0
TX:             4096
Current hardware settings:
RX:             256
RX Mini:        0
RX Jumbo:       0
TX:             256

The LAGG is set with 802.3ad and is the interface for the entire network.
On the Intel ET2 Quad interface, 1 port is used for WAN directly, all other 3 ports are used in the LAGG between VyOS and the switch.

This is why I haven’t consider it much as the root of the issue, otherwise I would expect it to affect all traffic.

I’m also working on testing having 2 machines, on separate Subnets, but same VLAN, to take VLANs out of the equation.

Is there any other statistics and so on I can take a look while doing the tests? like routing or nat?

if it’s possible you should try changing :

ethtool -G ethx tx 4096 rx 4096

on each interface that it’s part of LAG

@fernando begin from 1.3 VyOS has CLI commands

set interfaces ethernet eth0 ring-buffer rx 4096
set interfaces ethernet eth0 ring-buffer tx 4096
3 Likes