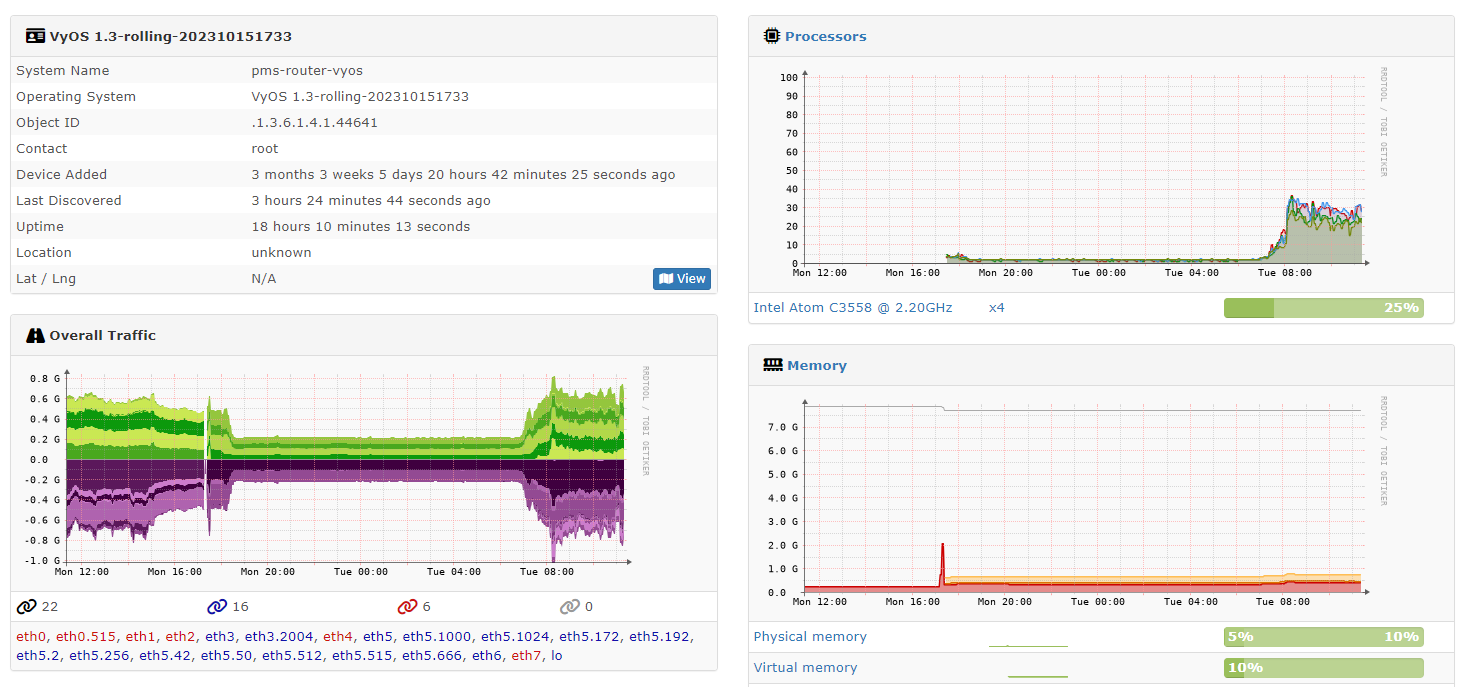
snmp looks high (to me)
Using librenms via docker to poll the device..
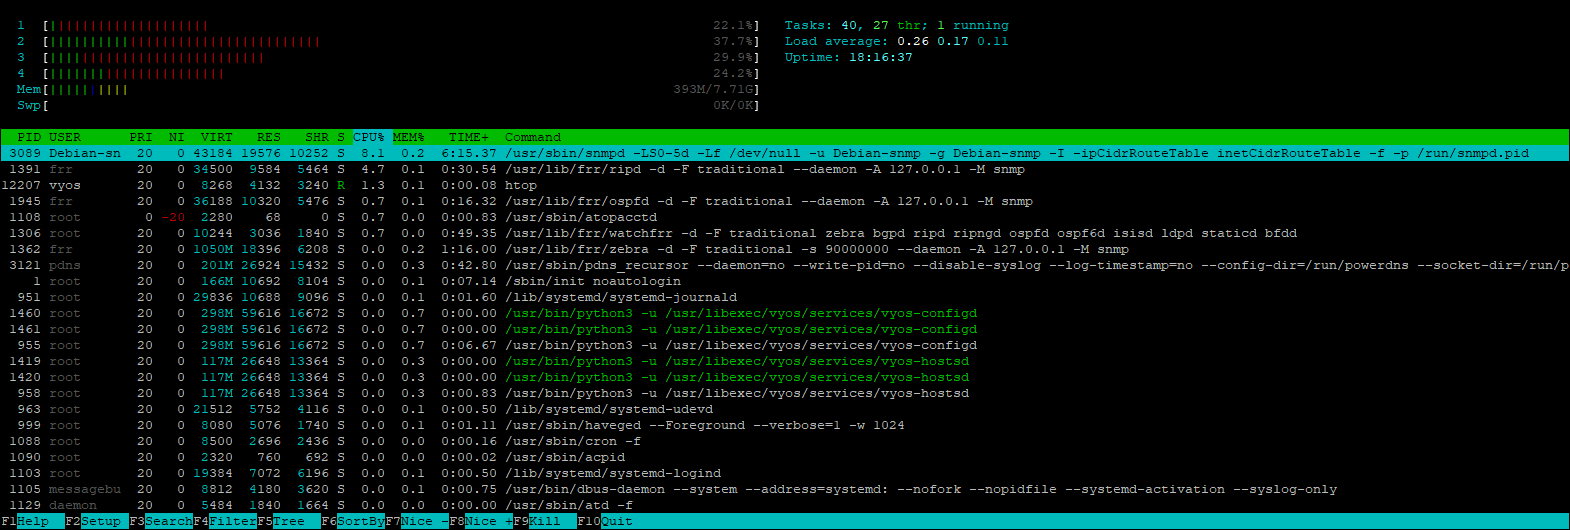
I wouldnt be too worried that the snmpd daemon uses 8% cpu when you are polling all its data - verify so you dont do a snmpwalk everytime.
I would be more worried why your ripd uses almost 5% after 18 hours of uptime?
CPU column is spikey, I’d also focus on TIME column.
Yeah but using for example ripd should normally only yield cpu activity when there is RIB information to send and/or receive. Which normally should be close to zero CPU time.
I saw that as well…
I’m not running rip
I am running OSPF…
One area…
So why is your ripd eating 4.7% CPU then? ![]()