Kernel Memory Leak on VyOS

Hello! I’m using VyOS version 1.2-rolling-2019XXXXXXX and there is a memory leak that correlates with the throughput of traffic.

free -m
             total       used       free     shared    buffers     cached
Mem:          7943       2801       5142         11        110        185
-/+ buffers/cache:       2505       5437
Swap:            0          0          0
vmstat -s
      8134532 K total memory
      2868904 K used memory
      1700432 K active memory
       107784 K inactive memory
      5265628 K free memory
       112868 K buffer memory
       189924 K swap cache
            0 K total swap
            0 K used swap
            0 K free swap
       178361 non-nice user cpu ticks
            0 nice user cpu ticks
       331328 system cpu ticks
    117620282 idle cpu ticks
         2341 IO-wait cpu ticks
            0 IRQ cpu ticks
      7879170 softirq cpu ticks
            0 stolen cpu ticks
       122739 pages paged in
       458001 pages paged out
            0 pages swapped in
            0 pages swapped out
   3012779657 interrupts
   1171682478 CPU context switches
   1569795929 boot time
       120566 forks

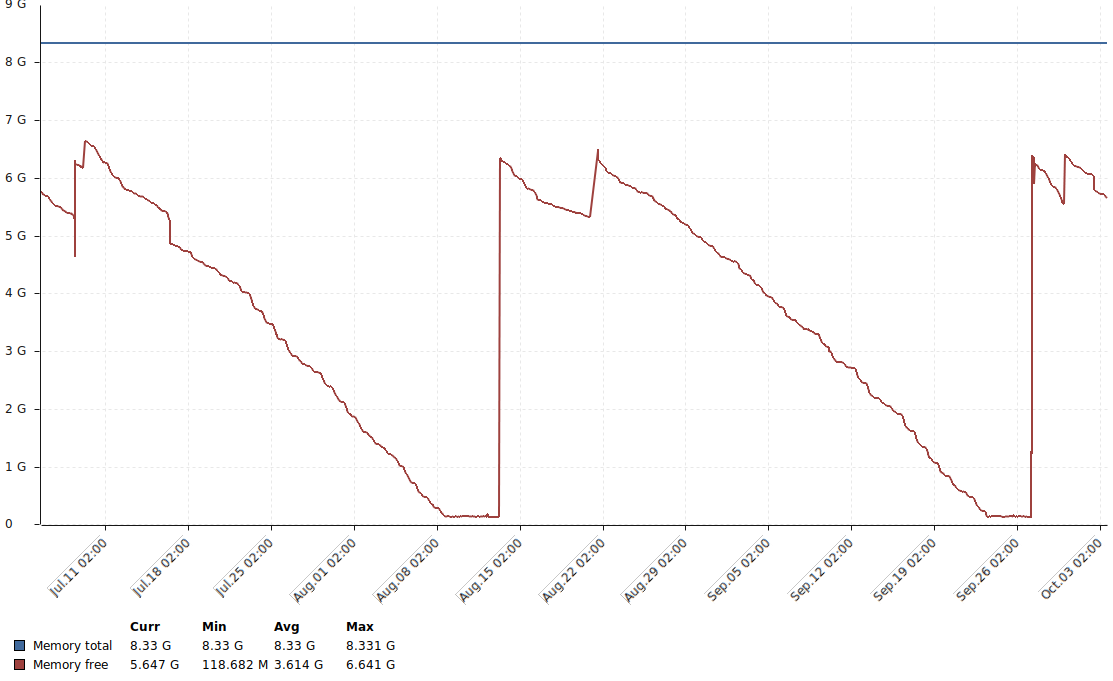
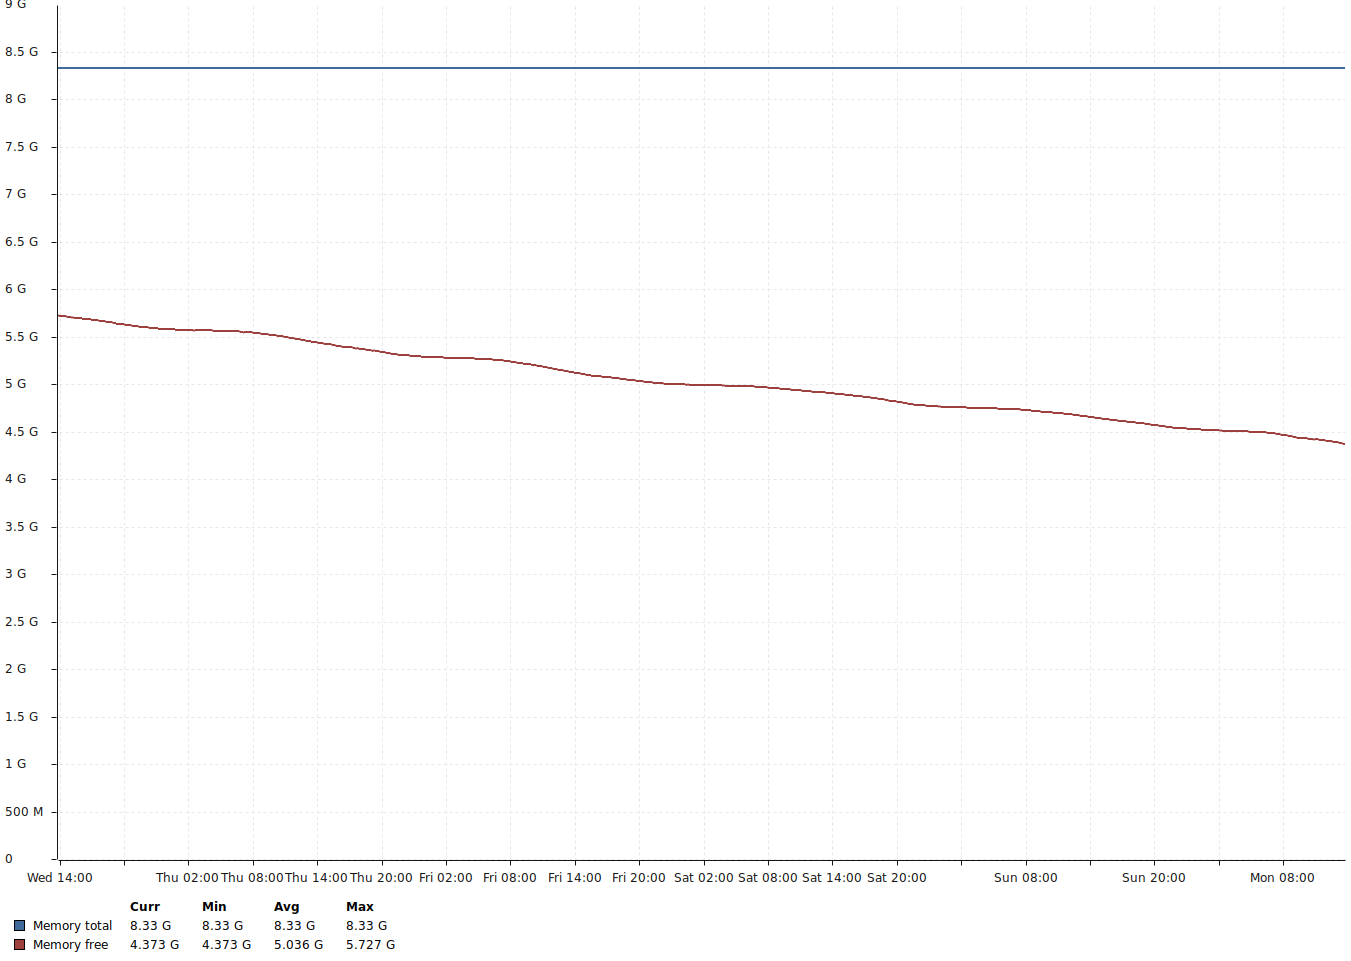
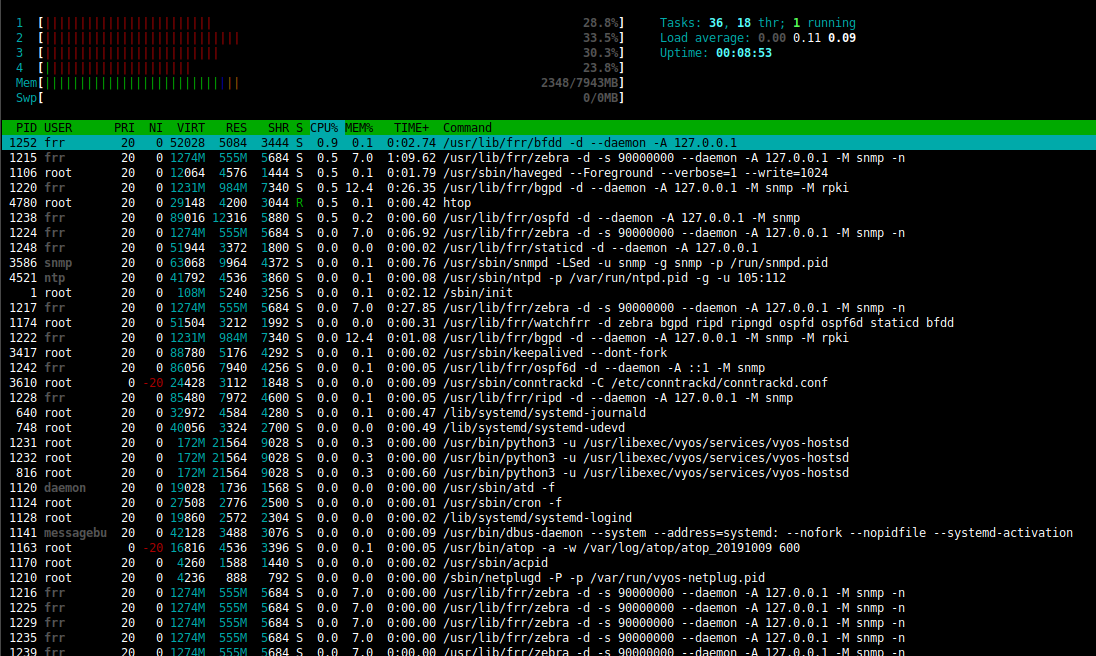
The size of free memory decreases with time, but the size of active and inactive memory does not change. The size of the memory of frr daemons will not change.
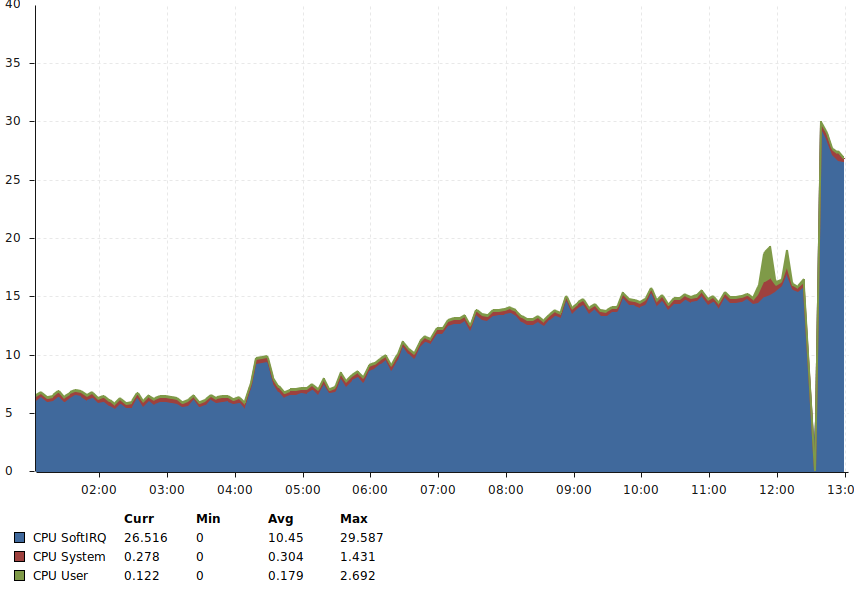
I think the problem is with the network card drivers (ixgbe):
https://lkml.org/lkml/2019/8/11/167
How to patch the kernel?

Hi, @Harunaga, current rolling releases use latest intel ixgbe driver. You can try manually build package GitHub - vyos/vyos-ci: VyOS Continous Integration with patch. Can you provide me last /var/log/atop/atop_XXXX file?

https://lore.kernel.org/netdev/20190911165014.10742-2-jeffrey.t.kirsher@intel.com/

But in the kernel version 4.19.70 this patch is not applied.

VyOS use not kernel own ixgbe module. run for check it

sudo modinfo ixgbe

Can you also show output of commands

sudo cat /proc/slabinfo
sudo cat /proc/meminfo

modinfo.txt (5.2 KB)
slabinfo.txt (13.3 KB)
meminfo.txt (1.3 KB)

I can’t confirm now, that ixgbe module ‘eat’ all RAM. Can you provide meminfo and slabinfo when free memory been very low? If you need help with modules patch, I think I can help you make pakage for test this issue.

Hello!
Graph for the last five days:

I provide meminfo and slabinfo:

meminfo.txt (1.3 KB) slabinfo.txt (13.3 KB)

How to build ixgbe-5.6.3 module?

@Harunaga you can try latest rolling, it has new ixgbe

vyos@R1# sudo modinfo ixgbe
filename:       /lib/modules/4.19.76-amd64-vyos/updates/drivers/net/ethernet/intel/ixgbe/ixgbe.ko
version:        5.6.3

vyos@R1# run show version 
Version:          VyOS 1.2-rolling-201910080117
Built by:         autobuild@vyos.net

For building own driver, you need see GitHub - vyos/vyos-ci: VyOS Continous Integration
Can you confirm and tell me if memory leak problem solved in latest rolling?

Thanks for the help. I will test the latest rolling.

In version 1.2-Rolling-201910080117, I lost the 82574L adapters:

e1000e: disagrees about version of symbol module_layout

I have to roll back to the previous version. Software interrupts high load.

@Harunaga, I checked it, really e1000e broken, we will try fix it.

root@R1:~# modprobe e1000e
modprobe: ERROR: could not insert 'e1000e': Exec format error

You see that RSS doesn’t work? Or you mean RPS?

RSS work. The interrupt load on all cores has increased.

I’ve updated the package lists (a change in GitHub - vyos/vyos-world: VyOS metapackage was erroneously not pushed to upstream after manual tests—sorry, my fault!).
Next build should have it right.

In the latest rolling release, I have a problem with high CPU usage:


# cat /proc/interrupts 
           CPU0       CPU1       CPU2       CPU3       
  0:          7          0          0          0   IO-APIC   2-edge      timer
  4:          0          0          0         20   IO-APIC   4-edge      ttyS0
  8:          0          0          1          0   IO-APIC   8-edge      rtc0
  9:          0          0          0          0   IO-APIC   9-fasteoi   acpi
 16:         66          0          0          0   IO-APIC  16-fasteoi   ehci_hcd:usb1
 18:          0          0          0          0   IO-APIC  18-fasteoi   i801_smbus
 23:          0          0         29          0   IO-APIC  23-fasteoi   ehci_hcd:usb2
 27:          0       4042          0          0   PCI-MSI 512000-edge      ahci[0000:00:1f.2]
 36:   64759745          0          0          0   PCI-MSI 1050624-edge      eth2-TxRx-0
 37:          0   65980121          0          0   PCI-MSI 1050625-edge      eth2-TxRx-1
 38:          0          0   66293362          0   PCI-MSI 1050626-edge      eth2-TxRx-2
 39:          0          0          0   66340412   PCI-MSI 1050627-edge      eth2-TxRx-3
 40:       1420          0          0          0   PCI-MSI 1050628-edge      eth2
NMI:         74         73         76         68   Non-maskable interrupts
LOC:     583535     582829     584423     583333   Local timer interrupts
SPU:          0          0          0          0   Spurious interrupts
PMI:         74         73         76         68   Performance monitoring interrupts
IWI:          0          0          0          0   IRQ work interrupts
RTR:          2          0          0          0   APIC ICR read retries
RES:     244378     265526     236929     276985   Rescheduling interrupts
CAL:       1365       1708       1590       1731   Function call interrupts
TLB:         39         18         36         39   TLB shootdowns
TRM:          0          0          0          0   Thermal event interrupts
THR:          0          0          0          0   Threshold APIC interrupts
DFR:          0          0          0          0   Deferred Error APIC interrupts
MCE:          0          0          0          0   Machine check exceptions
MCP:          8          9          9          9   Machine check polls
HYP:          0          0          0          0   Hypervisor callback interrupts
HRE:          0          0          0          0   Hyper-V reenlightenment interrupts
HVS:          0          0          0          0   Hyper-V stimer0 interrupts


top - 15:11:58 up 42 min,  1 user,  load average: 0.22, 0.08, 0.06
Tasks: 113 total,   1 running,  67 sleeping,   0 stopped,   0 zombie
%Cpu(s):  0.2 us,  0.3 sy,  0.0 ni, 69.5 id,  0.0 wa,  0.0 hi, 30.0 si,  0.0 st
KiB Mem:   8134128 total,  2628516 used,  5505612 free,    39020 buffers
KiB Swap:        0 total,        0 used,        0 free.   180368 cached Mem

Can you show output of next commands

show interfaces ethernet eth2 statistics
sudo ethtool -g eth2
sudo ethtool -c eth2
show hardware pci

The good news is memory doesn’t leak.

diag.txt (12.2 KB)

I think you need increase ring buffers, because in stat
rx_missed_errors: 750195
You can execute sudo ethtool -G eth2 rx 4096 tx 4096 for increase ring buffers, but be careful, might be short link up/down. After increasing ring buffers, irq and cpu load might be less.
And I see rx_csum_offload_errors: 52804444 for some reason. Guess new ixgbe better detect these packet.

I increased the ring buffer, but CPU load did not change.

$  sudo ethtool -g eth2
Ring parameters for eth2:
Pre-set maximums:
RX:		4096
RX Mini:	0
RX Jumbo:	0
TX:		4096
Current hardware settings:
RX:		4096
RX Mini:	0
RX Jumbo:	0
TX:		4096