My preferred “least-effort” option is check_mk with check_mk_agent.sh over ssh. That gives you availability/alerts and basic metrics that at least allow for rough capacity planning. “Production-ready” monitoring (that’s NOT MISSING that one dataset that you need so desperately) is only possible with mostly custom code/configs imho (even with pricey commercial solutions that claim to cover everything).
My “no-regrets dreamteam” around vyos:
- check_mk for availability monitoring (typically at least 2 instances for internal/external view)
- telegraf/influxdb/grafana for performance-monitoring
- graylog for logs (and optionally netflow) with pure rsyslog for log-shipping
- security onion for deep dives into security/traffic (I’m usually collecting/storing a couple of days/weeks of raw traffic from all relevant interfaces)
- optional: rabbitmq for optimized message routing, buffering during maintenance of targets systems or to workaround security restrictions…
these are the main dashboards for daily operation:
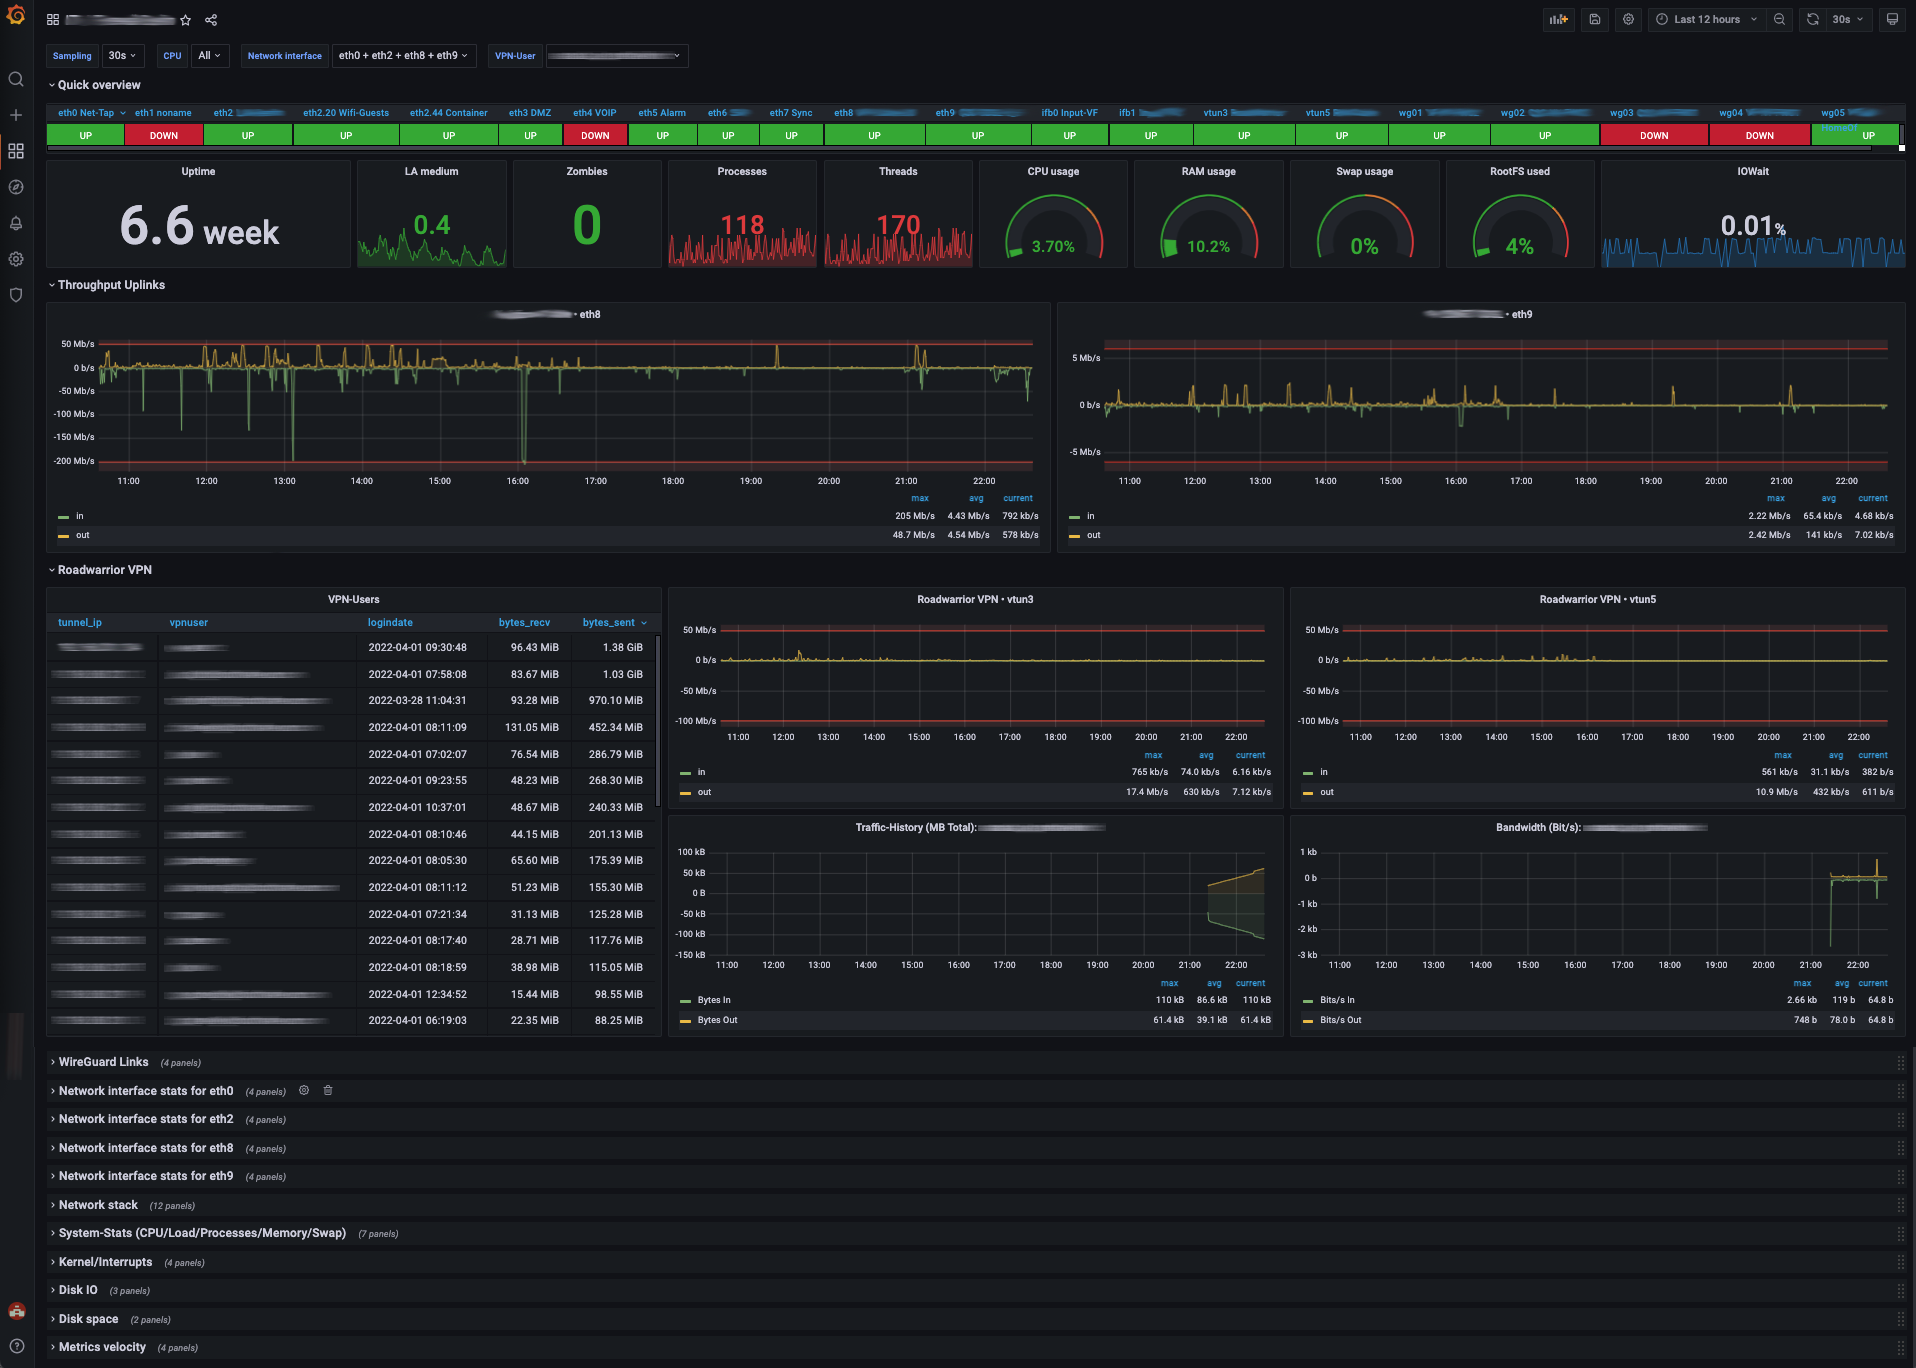
Grafana provides the general Bandwidth/Firewall-Status (enhanced version of this dashboard with pandemic-induced focus on VPN-Server metrics)
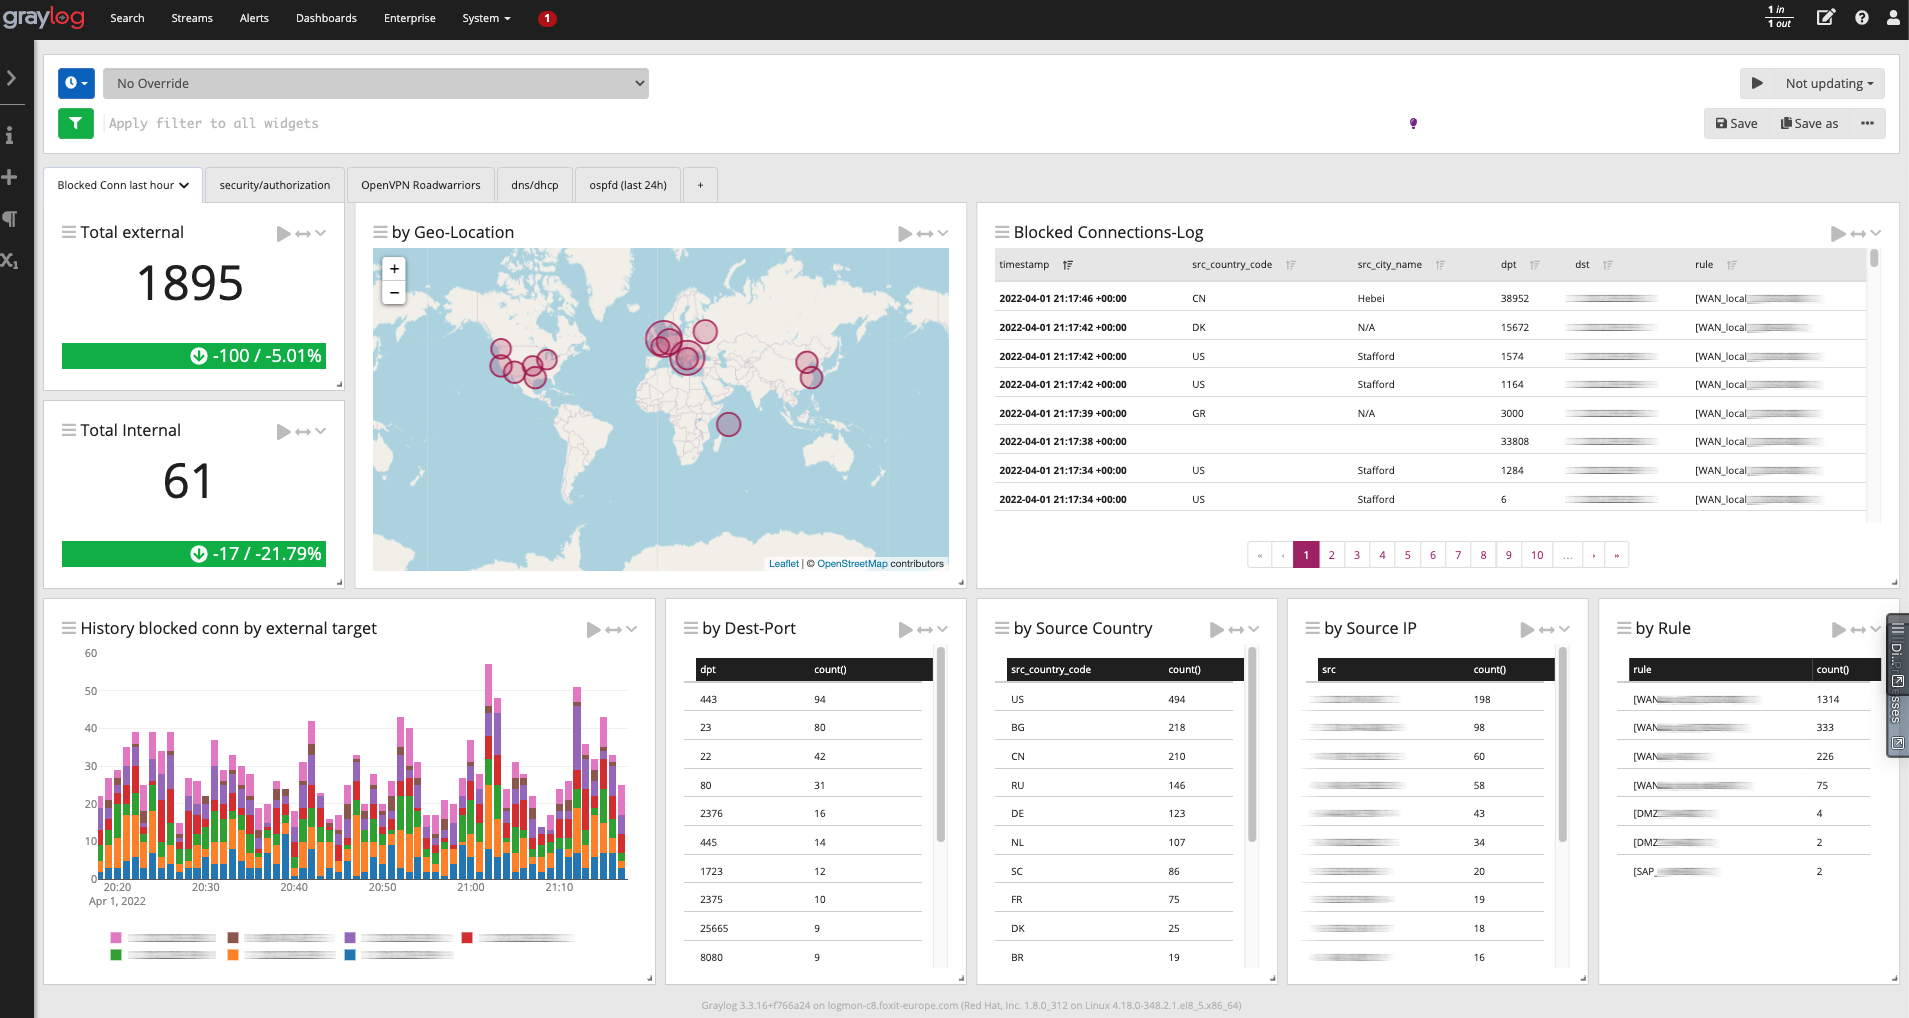
Graylog gives a useful event-based overview on the network/firewall status:
to make that all happen the following components were needed:
- rsyslog-configs with custom templates for agentless shipping of messages in gelf-format
- some python for collecting vpn-server metrics via telegraf
- grafana dashboard
- a couple of lines of code in vyos-postconfig-bootup-script that puts everything into place on reboots