Wondering if anyone has had any experience setting up visualisation monitoring for VyOS?
I have been busy searching the web trying to find an answer and I see people mentioning the following setups.
Telegraf > InfuxDB > Grafana
VyOS > Greylog > ElasticSearch > Grafana
ElasticSearch > Logstasg > Kibana
Unfortunately none of the methods have a how to guides and it seems a massive learning curve to learn grafana, greylog or kibana. I did get Telegraf > InfuxDB > Grafana operational but now just staring at nothing in Grafana as I need to understand Influx script and then make sense of how to create a graph/table
I also stood up a LibreNMS system, but it does not show what traffic is passing through or external connection attempts etc. Mainly CPU temp, Ports are up/down and traffic weight.
Adding syslog support into LibreNMS also does not help, as it only produces what is already possible through VyOS CLI. I’m looking at something similar to this project (GitHub - pfelk/pfelk: pfSense/OPNsense + Elastic Stack) where I can gather some more detail at a single glance.
Happy for suggestions, ideas or solutions with a guide, would be awesome!
I still had no time to prepare a monitoring tool for my VyOS.
But in the past I was able to monitor networking equipment using Prometheus+Grafana. Most valuable information was recollected using snmp exporter (in Prometheus, think of exporters as little modules). There a tons of exporters that helps you get useful information.
As every monitoring tool, there’s a learning curve on how to setup it up properly. But that is something you’ll have to deal with, regardless what monitoring tool you choose.
Thanks for the reply. I understand that Telegraf is already in build 1.3 and active in 1.4 … not sure about Prometheus, but will take a look. I was hoping from this tread that some ones managed to battle the hard yards and point me in the right direction as to how that information is pulled out of the agents and presented. I can only hope
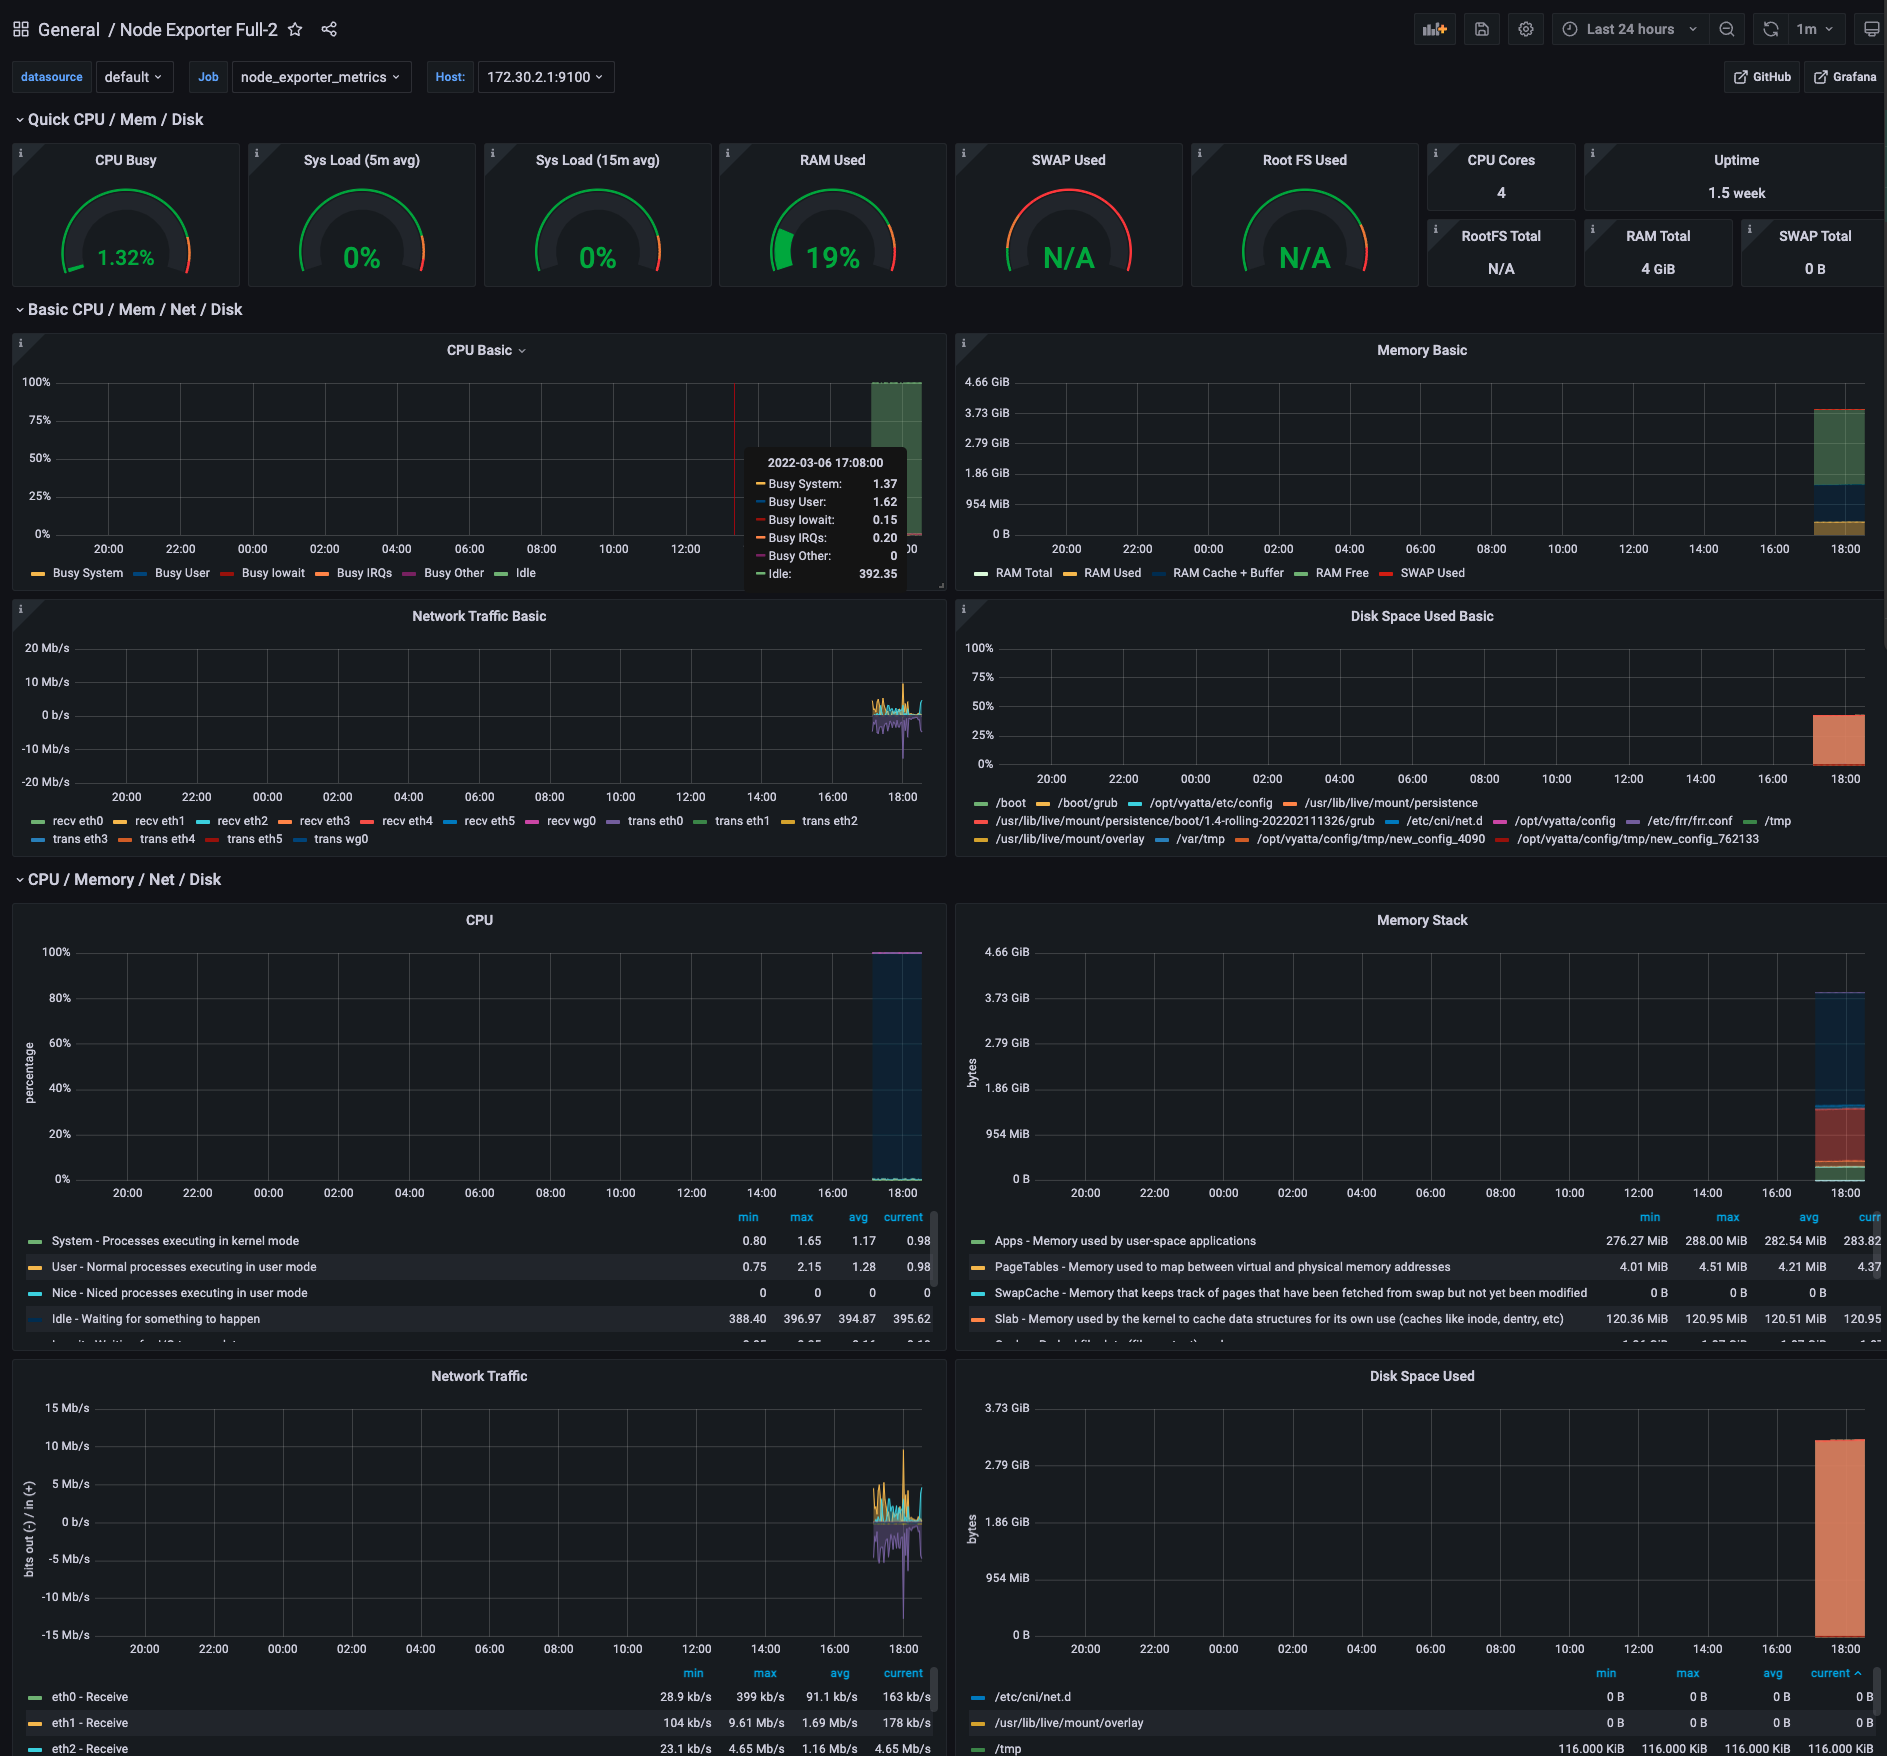
Vyos has all the framework to support the standard prometheus node_exporter package. Any tutorial for setting up prometheus+grafana+node_exporter will apply to the standard Linux parts of Vyos (Host/CPU/Network/disk stats)
The Prometheus node_exporter package is not in the standard 1.4 builds, you need to add it either to your custom build if you have set up your dev environment, or you can apt-get install the relevant packages every time you upgrade:
vyos@vyos:~$ sudo apt list --installed | match node

prometheus-node-exporter-collectors/now 0+git20210115.7d89f19-1 all [installed,local]
prometheus-node-exporter/now 1.1.2+ds-2.1 amd64 [installed,local]
These two packages, when installed, will configure the standard prometheus node collector service
vyos@vyos:~$ sudo systemctl status prometheus-node-exporter
● prometheus-node-exporter.service - Prometheus exporter for machine metrics
     Loaded: loaded (/lib/systemd/system/prometheus-node-exporter.service; enabled; vendor preset: enabled)
     Active: active (running) since Thu 2022-02-24 08:59:41 UTC; 1 weeks 3 days ago
       Docs: https://github.com/prometheus/node_exporter
   Main PID: 866 (prometheus-node)
      Tasks: 9 (limit: 4689)
     Memory: 31.5M
        CPU: 41.769s
     CGroup: /system.slice/prometheus-node-exporter.service
             └─866 /usr/bin/prometheus-node-exporter

vyos@vyos:~$ sudo netstat -anvp | grep LISTEN | grep 9100
netstat: no support for `AF INET (sctp)' on this system.
netstat: no support for `AF INET (sctp)' on this system.
tcp6       0      0 :::9100                 :::*                    LISTEN      866/prometheus-node
NB: the service listens on all interfaces so make sure you have your firewall filters set up appropriately to allow querying the metrics only from trusted networks/hosts
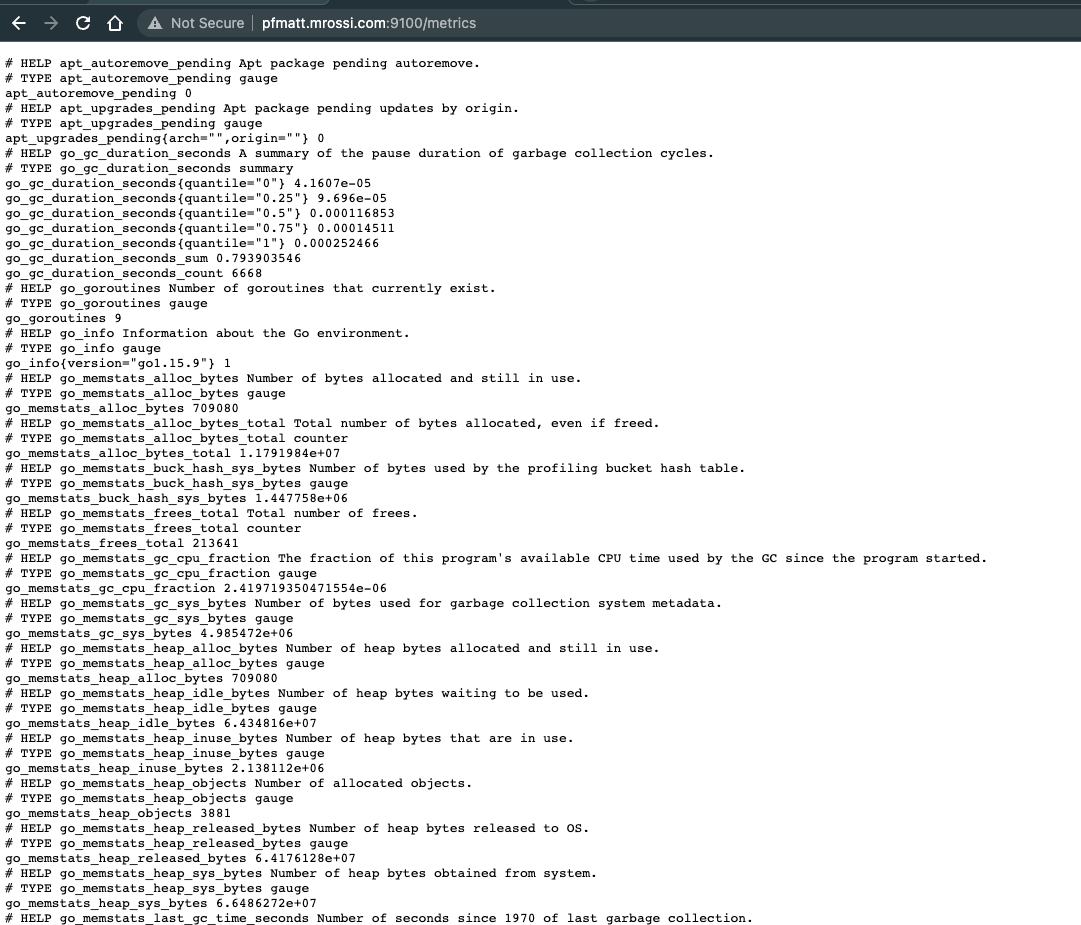
Once the local node_exporter service is up and running it will expose default linux system metrics on vyos_ip:9100/metrics
or roll out your own.
There is also a prometheus exporter for FRR, that could be integrated in the mix, but I couldn’t find a ready made grafana dashboard to go with it. This would also need to be manually installed/added to the 1.4 rolling build
This brings up the container and I run through the wizard create a username, organization, bucket. I then provides me with a token.
I then modifying /etc/telegraf.conf and get it pushing over to InfluxDB:
I just changed the following section.
[[outputs.influxdb_v2]]
  urls = ["http://dockersrv02.lan:8086"]
  token = "abcd" // need this created in InfluxDB first
  organization = "localnet"
  bucket = "vyos-bucket"
Needed to punch a hole in the firewall to allow traffic from Local to Inside on port 8086.
Also require to start the telegraf service.
I run telegraf --debug to test if it is grabbing information - all good here.
At this point I hit a blank as I have no idea how to browse the data that has come into InfluxDB (looks like InfluxDB has it’s own graphing tool? why is this not used - still to read more.)
I add the InfluxDB using flux query language which supports the token, org and bucket information.
That is about the point where I get to… How can I see what is being passed through? maybe someone knows? Also if Prometheus has some preconfigured graphs it may be helpful?
Influxdb is a time serie database, it used yo have an admin gui but that has been deprecated, if you want to check whether Vyos is sending data to influx correctly, you need to either:
add the visualization container for Influx, called chronograph
open a shell to the influxdb container, and run queries on the the influx cli
Neither prometheus nor influxdb have ‘pre-configured graphs’, Grafana has already made dashboards tailored to specific data collection agents and specific backend databases
In my previous post I linked to a dashboard that has pre-configured widgets when you use prometheus’s node_exporter as a collection agent and prometheus as a backend.
If you are using telegraf, one dashboard may be this one: InfluxDB Linux Server Telegraf | Grafana Labs
but it really depends on the model used for collecting and stoing data into the database …
Prometheus, using exporters,is in charge of collection data. For example you can get in/out traffic from every interface using snmp.
Then, in grafana you “import” data collected by Prometheus, and then you can create desired graphs.
In a simplified scenario, almost every advance combination of monitoring tools works like that. Basic tasks that these tools does:
Tool that collect data (and stores it) → Prometheus
Tool that reads the data and generates graphs, dashboards, etc → Grafana
Alarm tools: based on defined values, alerts can be triggered → AlertManager
Thanks n.fort. Guess it’s a learning curve I’ll need to get to sooner than later.
My concern is not having enough visibility with VyOS monitoring or looking at the messages log. Never seem to get any hits from the wan to the firewall even with logging enabled which troubles me? With previous opnsense firewall I would see constant hits to the firewall. Believe I had a post about monitoring a while back and never quite resolved it.
My preferred “least-effort” option is check_mk with check_mk_agent.sh over ssh. That gives you availability/alerts and basic metrics that at least allow for rough capacity planning. “Production-ready” monitoring (that’s NOT MISSING that one dataset that you need so desperately) is only possible with mostly custom code/configs imho (even with pricey commercial solutions that claim to cover everything).
My “no-regrets dreamteam” around vyos:
check_mk for availability monitoring (typically at least 2 instances for internal/external view)
telegraf/influxdb/grafana for performance-monitoring
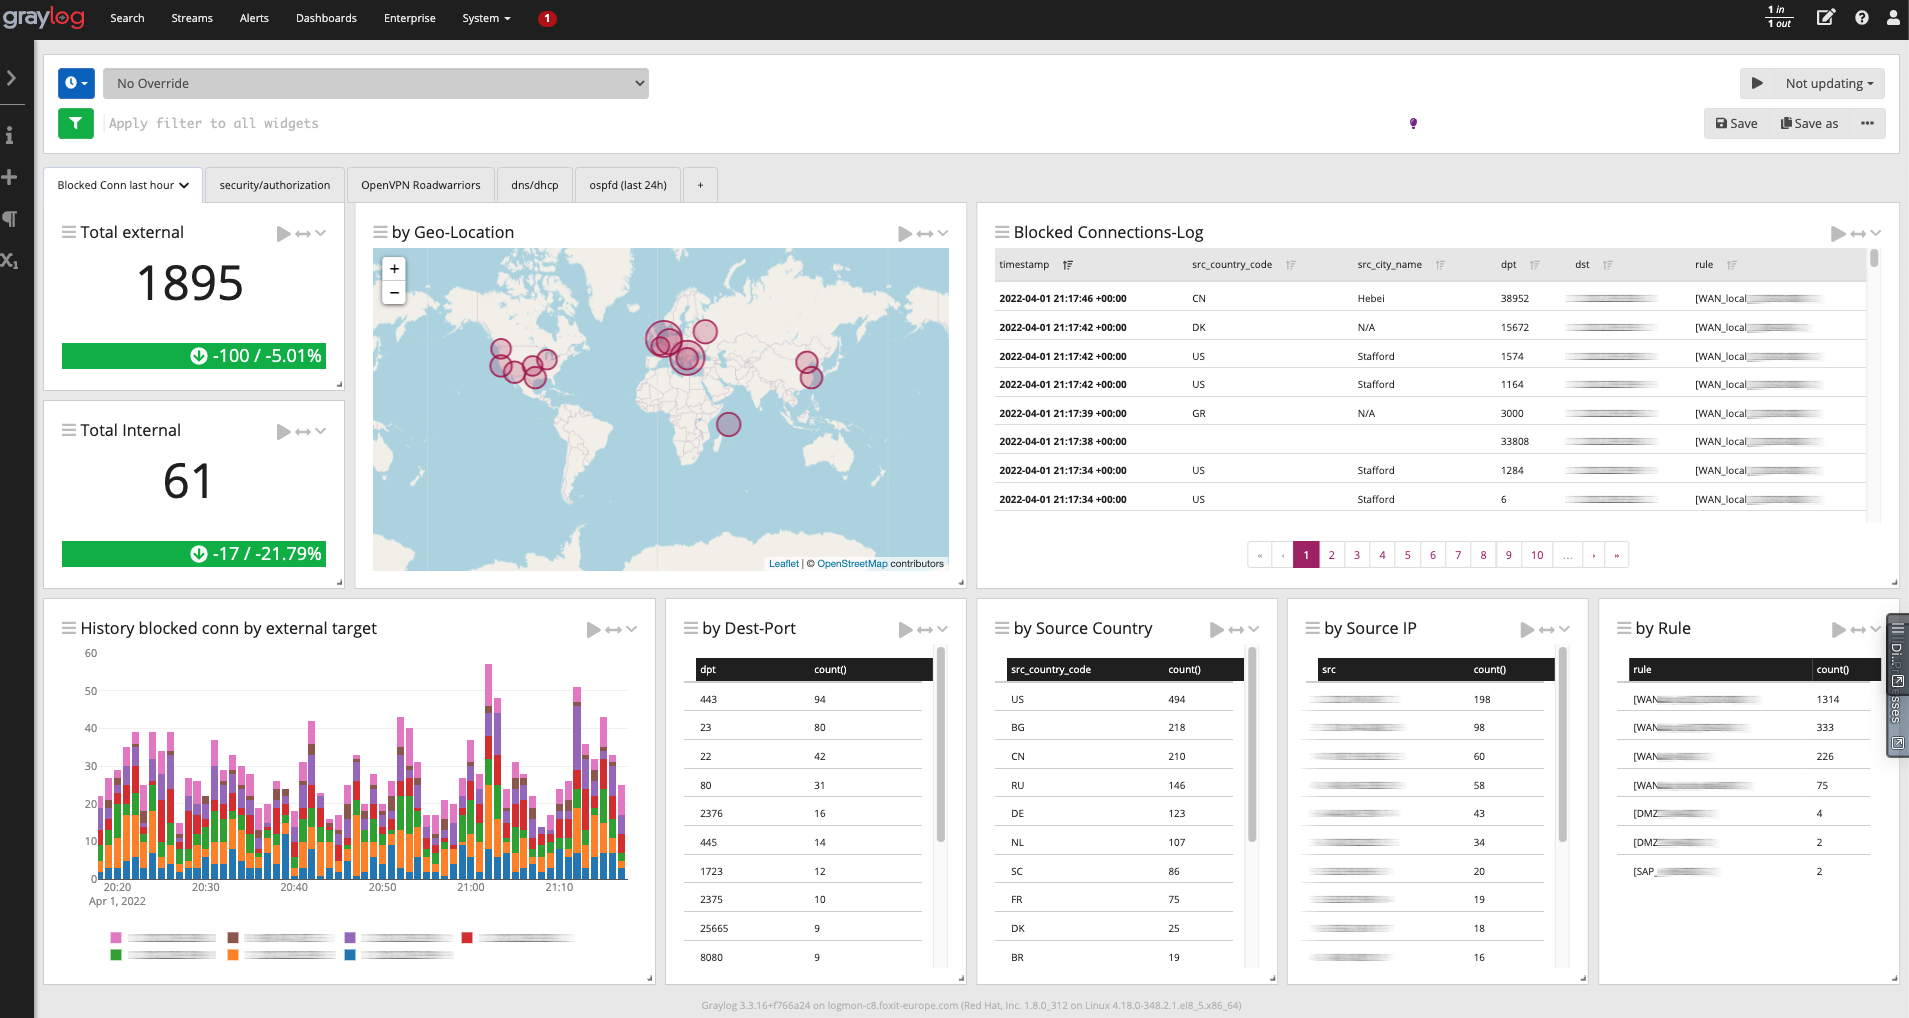
graylog for logs (and optionally netflow) with pure rsyslog for log-shipping
security onion for deep dives into security/traffic (I’m usually collecting/storing a couple of days/weeks of raw traffic from all relevant interfaces)
optional: rabbitmq for optimized message routing, buffering during maintenance of targets systems or to workaround security restrictions…
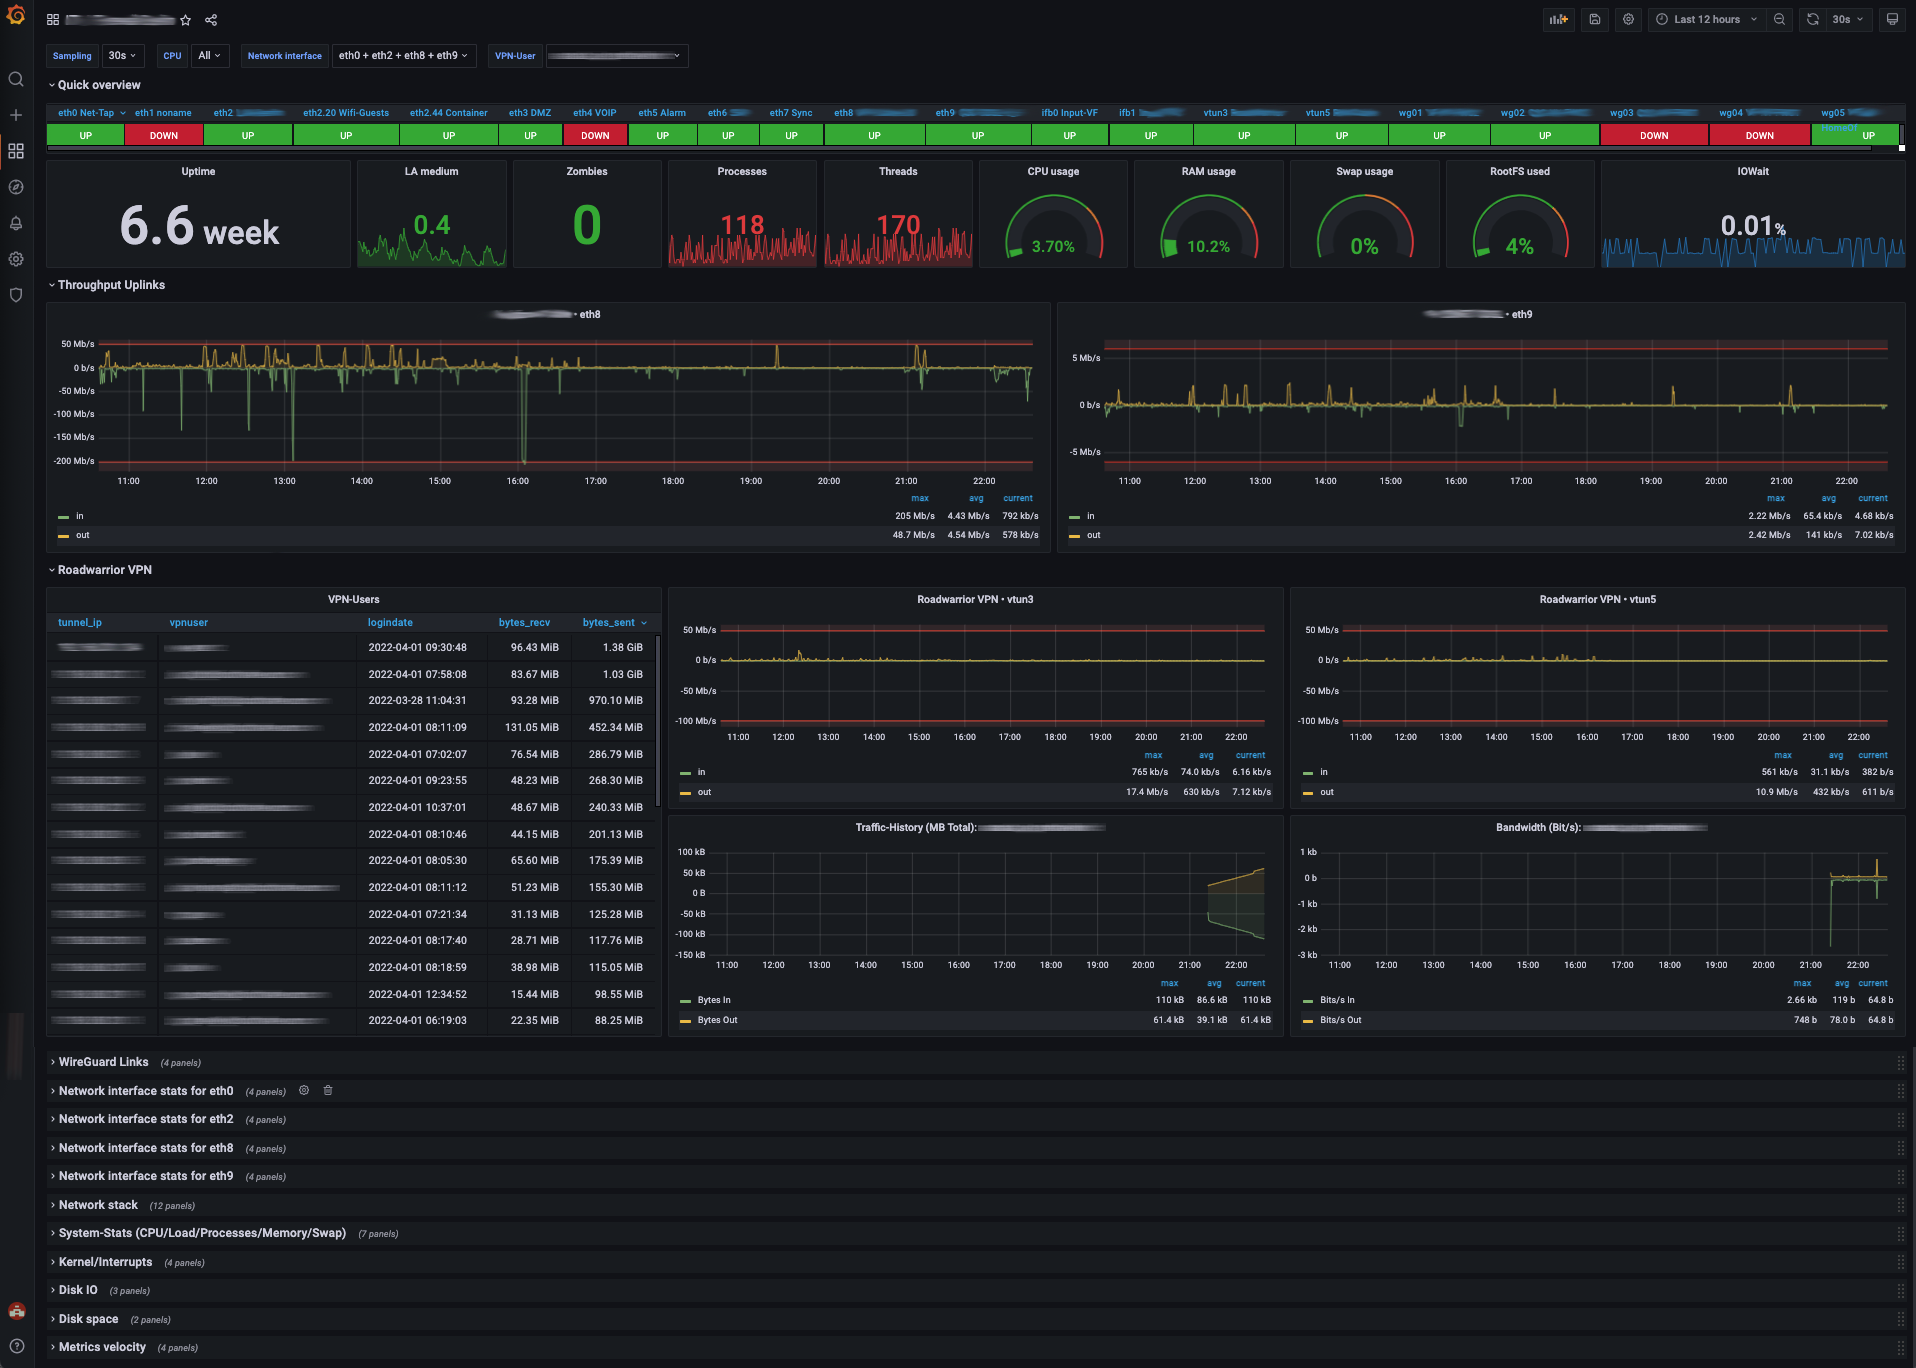
these are the main dashboards for daily operation:
Grafana provides the general Bandwidth/Firewall-Status (enhanced version of this dashboard with pandemic-induced focus on VPN-Server metrics)
I am using version 1.3 so it’s not part of the CLI.
I’m using telegraf without any issues since vyos 1.2.x - debian package of your choice + config-files + scripts/custom checks (e.g. vpn server metrics) + a couple of commands in vyos-postconfig-bootup.script does the trick
Yeah there are heaps of options but as I found getting the data out of VyOS is the simple thing, though having a easy one stop shop for monitoring is another. Requirement of a data collector then a graphing tool, then the time having to spend tweaking it. Like @luratech mentioned, check_mk, telegraf/influxdb/grafana, graylog and security onion … that is a lot of tool just to get information needed
I spent sometime looking into it and had to put it on the side for now, as I just couldn’t get what I wanted. Need to get more familiar with graphing tools.
Finding an “easy one stop shop for monitoring” is as tricky as finding “an easy one stop option for transportation”. There are just too many different aspects with completely different requirements - service availability, performance, security… all require different data - just as you need completely different vehicles for transportation of people, computers or oil.