We have a HP ProLiant DL360G5 server with a 4-core INTEL XEON processor running VyOS 1.2.9-S1 without any virtualization. We have configured BGP with a remote ASN and we are sending around 300 Mbps of IPT traffic. However, we are facing a problem with the virtual memory usage, which is i
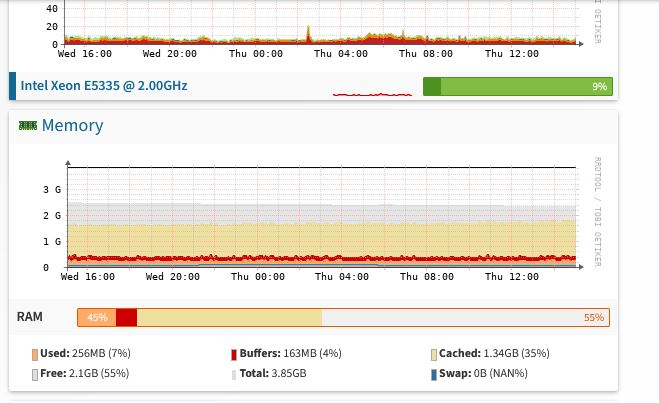
This looks like the normal behavior of Linux and it’s memory allocation. Memory is only freed if required. As long as RAM FREE is in good shape I would not have any concern.
Or did you see the Linux OOM-killer reaping processes?
You should also consider upgrading to 1.3 LTS or build your own image or help testing the new LTS 1.4 branch.
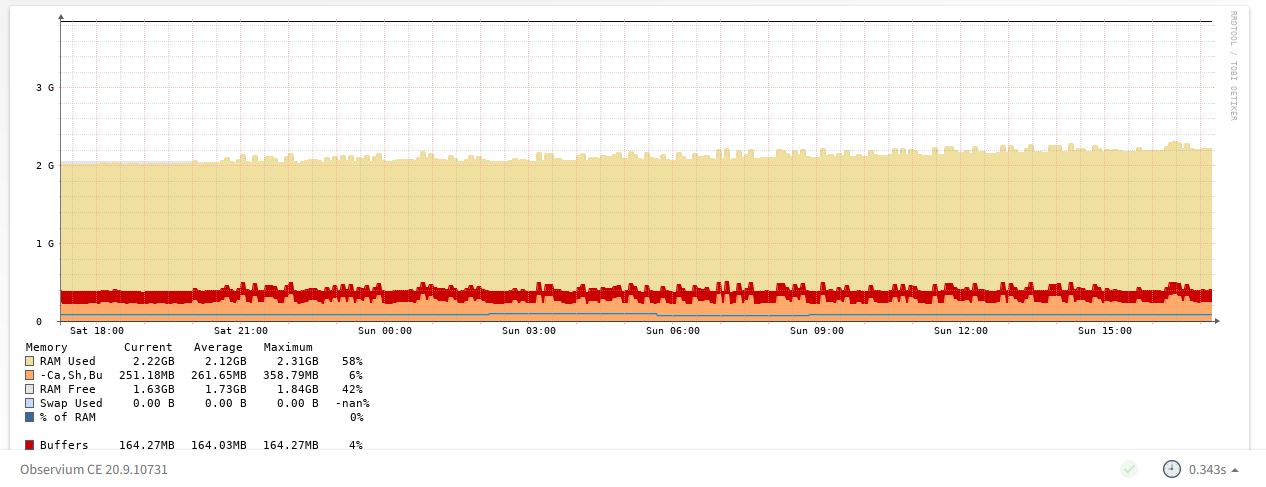
Also from the look of your graph there doesnt seem to be any increase of that sort as you mentioned.
And as @c-po mentioned thats the nature of Linux to use available memory as cache/buffers when needed to gain performance mainly as a readcache.
The buffers will be dropped once “real” memory for applications are needed.
For example my Ubuntu 23.10 running on a 16GB box after a few days of uptime shows:
user@nuc:~$ free
               total        used        free      shared  buff/cache   available
Mem:        16261928     7810516     2573328     2144856     8381392     8451412
Swap:              0           0           0
While a VyOS 1.5-rolling from november running as a VM guest with 2GB of RAM who is currently basically just hosting a webserver (webfs) shows this after a few days of uptime:
vyos@vyos:~$ free
               total        used        free      shared  buff/cache   available
Mem:         2036932      732000     1032936        2440      425116     1304932
Swap:              0           0           0
You can also do a cat /proc/meminfo to get more stats regarding memory usage of your installation.
Basically “MemAvailable” is the one who tells you true amount of available memory (that is how much is available if all caches and buffers in the kernel are dropped).
That is “MemAvailable” from /proc/meminfo is basically the sum of free + buff/cache as seen by the “free” command.
@Apachez Thank you for the correction, its 2GB Virtual Memory that is showing up in SNMP server is escalating day after day, I have also added the screen shot, and thank you for your reply.